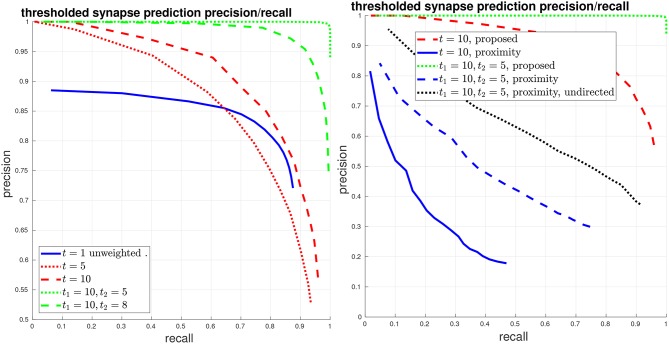
Figure 5.
Thresholded global connectome graph precision/recall. (Left) The solid blue curve shows the unweighted PR from the previous figure, which is equivalent to a threshold of t = 1. The red curves give symmetric thresholded PR at t = 5, 10. The green curves show asymmetric thresholded PR at t1 = 10, t2 = 5, 8. (Right) Comparison against the baseline using body-proximity. Focusing on strong error cases shows that while the proposed method only makes a few mistakes at t1 = 10, t2 = 5, the body-proximity baseline still performs comparatively poorly.

