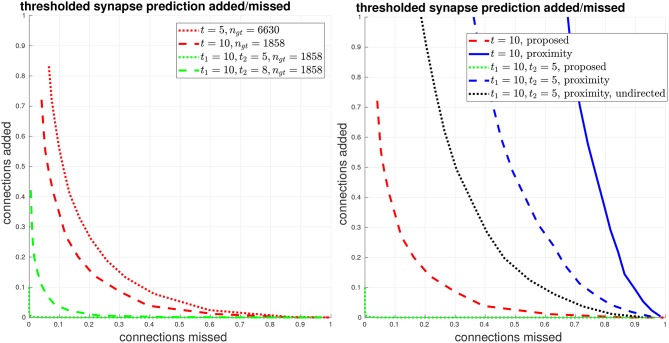
Figure 6.
Thresholded global connectome graph connections added/missed. (Left) The curves show errors in terms of connections that were added and missed, using the same thresholds as the PR curves in Figure 5. (Right) Comparison against the baseline using ground-truth body-proximity, both directed and undirected edges.

