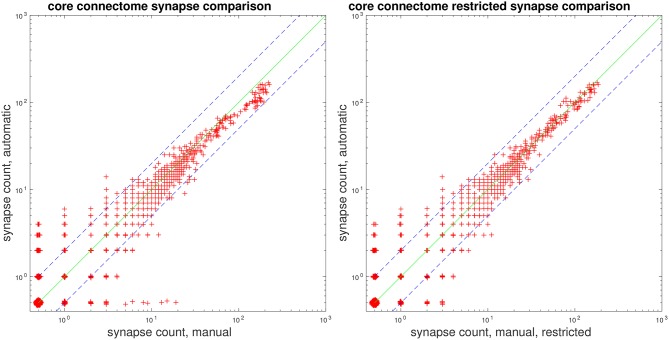
Figure 7.
Comparison of manual and automatic synapse counts, where each point indicates the counts for an edge in the connectome. Edge weights of 0 have been shifted to 0.5 to appear on the log plot. Dashed lines indicate y = 2x and . (Left) Comparison with full ground-truth connectome. (Right) Comparison after removing ground-truth autapses and collapsing multiple connections from one T-bar to the same postsynaptic body.

