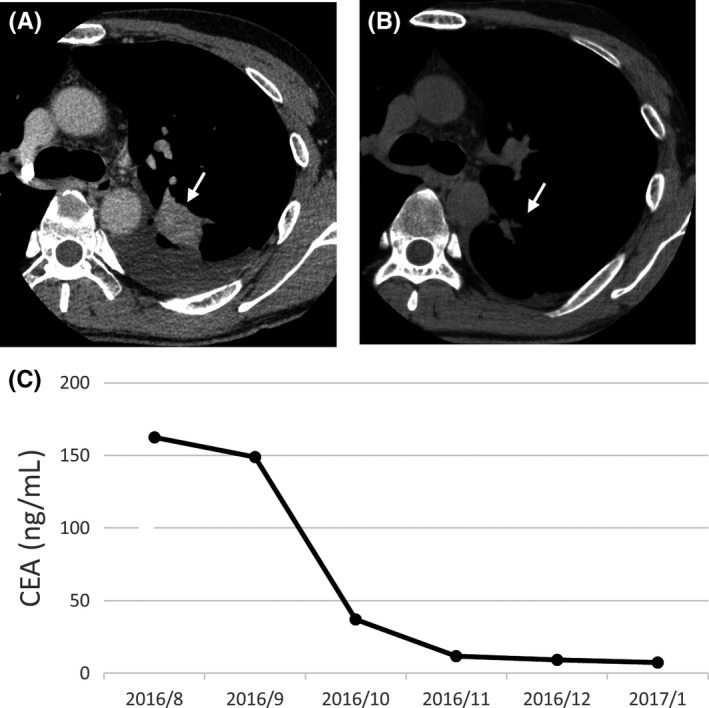
Figure 1.

Clinical course of the patient. A, B, Computed tomography scans of the chest showing the primary mass (arrow) in the lower left lobe of the lung immediately before (A) and 1 month after (B) the onset of afatinib treatment. C, Time course (year/month) of serum CEA concentration from the onset of afatinib treatment
