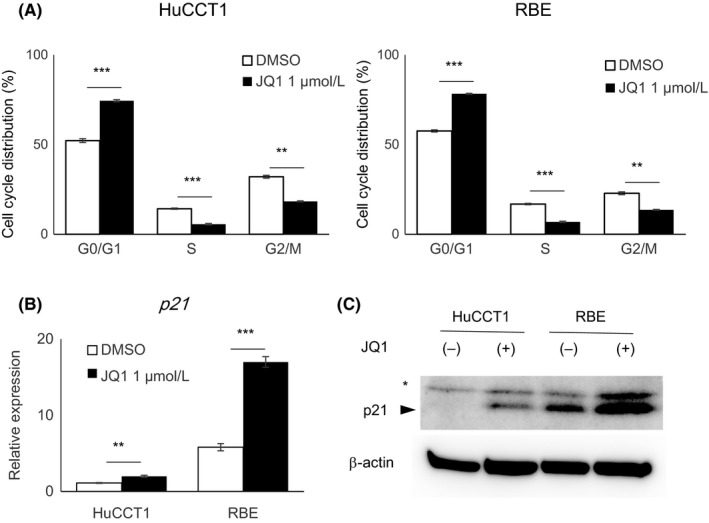
Figure 2.

Deceleration of the cell cycle in HuCCT1 and RBE cells by JQ1. A, HuCCT1 and RBE cells were treated with DMSO or JQ1 (1 μmol/L) for 24 h and stained with propidium iodide (PI) for cell cycle analysis by flow cytometry. Data are presented as mean ± SEM (n = 3, **P < 0.01, ***P < 0.001, Student's t test). B, Gene expression of p21, relative to ACTB, was determined by qRT‐PCR. Data are presented as the mean ± SEM (n = 4, **P < 0.01, ***P < 0.001, Student's t test). C, Protein expression level of p21 was assessed by western blotting. Asterisk indicates a non‐specific band
