Figure 4.

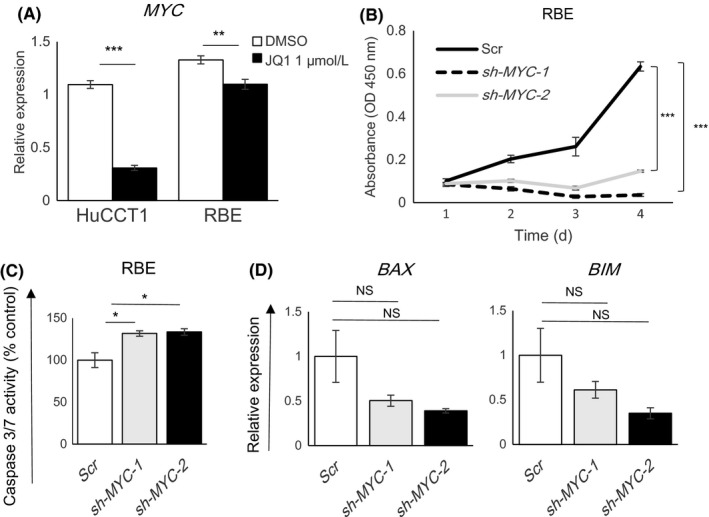
Suppression of the MYC gene did not fully recapitulate the effects of JQ1 in RBE cells. A, Gene expression levels of MYC in HuCCT1 and RBE cells were determined by qRT‐PCR after treatment for 24 h with DMSO or JQ1 (1 μmol/L). Data are presented as mean ± SEM (n = 4, **P < 0.01, ***P < 0.001, Student's t test). B, Proliferation of RBE cells was assessed after stable knockdown of MYC. Scr is the scrambled control shRNA. sh‐MYC‐1 and sh‐MYC‐2 are two different MYC‐knockdown shRNAs. Cell proliferation was measured by CCK‐8 assay over 4 days. Data are presented as the mean ± SEM (n = 4, ***P < 0.001, Student's t‐test). C, Caspase 3/7 activity of RBE cells after MYC knockdown relative to the scramble control. Data are presented as mean ± SEM (n = 4, *P < 0.05, Student's t test). D, Gene expression of BAX or BIM after MYC knockdown in RBE cells was determined by qRT‐PCR. Data are presented as mean ± SEM (n = 3, NS, not significant, Student's t test)
