Figure 3.

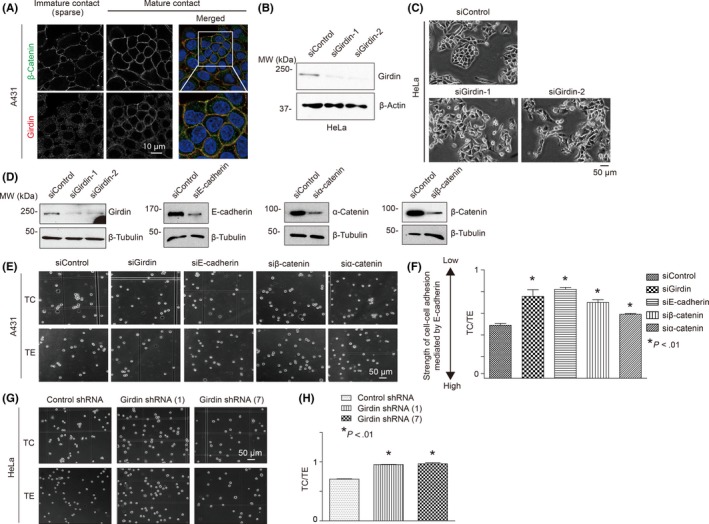
Girdin controls the strength of cell‐cell adhesion. A, Girdin localized at cell‐cell contacts. Its colocalization with β‐catenin was not evident in immature cell‐cell adhesion of A431 cells sparsely plated on dishes (left), whereas it was clearly observed in confluent cells with mature cell‐cell adhesion (right). B, C, HeLa cells depleted of Girdin showed morphology of scattered cells. D, Efficiency of siRNA‐mediated knockdown of Girdin, E‐cadherin, and α‐ and β‐catenins in A431 cells was shown by western blot analyses using the indicated antibodies. E, F, A431 cells transfected with the indicated siRNA were treated with trypsin for 30 minutes in the presence of either 0.1 mmol/L Ca2+ (TC) or 1 mmol/L EDTA (TE) at 37°C. The cells were dissociated by pipetting, and the number of particles was counted. Cells of each group were seeded in three 6‐cm dishes, followed by counting the numbers of all particles in the dishes and quantification. Representative images are shown in (E). The extent of cell dissociation was represented by the index TC/TE, where TC and TE are the total particle numbers after the TC and TE treatment, respectively (F). The TC/TE ratio represents the inverse strength of cadherin activity. G, H, shRNA‐mediated Girdin depletion decreased cadherin activity in HeLa cells, which is shown by high TC/TE values in the cell dissociation assay
