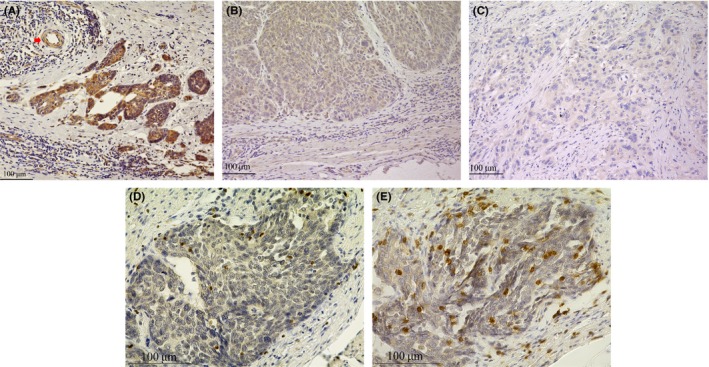
Figure 1.

Representative staining patterns of immune‐reactive milk fat globule‐epidermal growth factor factor 8 (MFG‐E8), CD8, and Foxp3 in tumor samples of esophageal squamous cell carcinoma. A, Endothelial cells of muscular blood vessels were used as internal positive control of MFG‐E8 expression (red arrow). Squamous cell carcinoma with MFG‐E8 expression stronger than that of the positive control was defined to have intensity score 2 (100×). B, Tumor cells with MFG‐E8 expression equal to that of the positive control were defined to have intensity score 1 (100×). C, Tumor cells with MFG‐E8 expression weaker than that of the positive control were defined to have intensity score 0 (100×). D, Immunohistochemical staining of intratumoral Foxp3+ T cells (200×). E, Immunohistochemical staining of intratumoral CD8+ T cells (200×)
