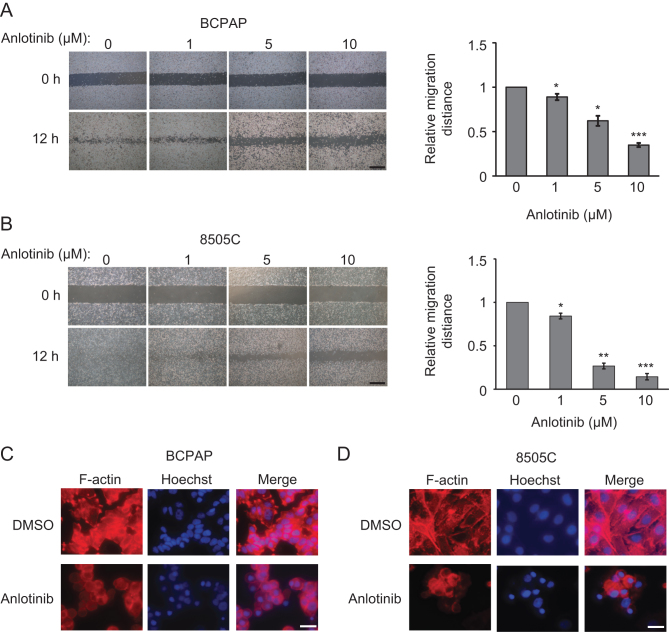
Figure 6.
The effects of anlotinib on the migration of thyroid cancer cells. (A and B) Representative images of wound-healing assays using BCPAP (A) and 8505C (B) cells in the presence of 0, 1, 5 and 10 µM anlotinib. Scale bars: 25 µm. The plots on the right show the quantification of wound healing assays. Data are shown as mean ± s.d. (n ≥ 3). (C and D) The expression and cellular distribution of F-actin in BCPAP (C) and 8505C cells (D). Cells were treated with DMSO or 10 µM anlotinib for 24 h, and then stained with rhodamine-phalloidin (red) for F-actin. Hoechst 33342 was applied to counter-stain the nucleus (blue). Scale bars: 100 µm.

 This work is licensed under a