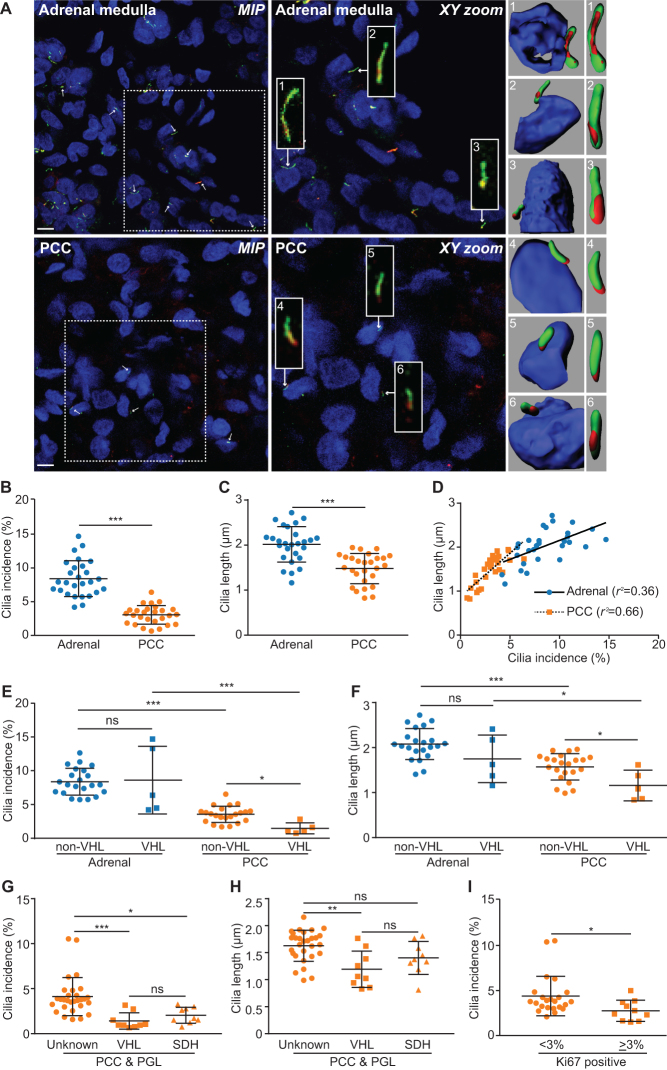
Figure 1.
Primary cilia incidence and length is reduced in PCCs relative to adjacent adrenal medulla. (A) Maximum intensity projections (MIP) of confocal Z-stacks of PCC and adjacent adrenal medulla. Tissue sections were processed for dual-immunofluorescent detection of the ciliary markers acetylated α-tubulin (green) and Arl13b (red). They were then counterstained with DAPI (blue) to detect nuclei. A single confocal section from the area demarked by the dashed box is shown zoomed (XY zoom). Individual cilia, indicated by arrows, are further enlarged in insets 1–6 and are shown as surface rendered 3D images in the panels on the right. Scale bars = 10 µm. (B) Quantification of primary cilium incidence in 27 paired PCC and adjacent adrenal medulla tissue samples. (C) Quantification of axoneme length (from confocal Z-stacks) from cells that had a primary cilium in PCC and adjacent adrenal medulla. (D) Cilia incidence and length correlate in both PCCs and adjacent adrenal medulla, with a more significant relationship in tumor than normal tissue. (E and F) Cilia incidence and length in 27 paired PCCs and adrenal medulla samples comparing individuals with (n = 5) and without (n = 22) germline mutations in VHL. (G and H) Cilia incidence and length in 47 PCC/PGL comparing those with a germline mutations in VHL (n = 9), to tumors from patients with germline mutations in SDHx (n = 9) and those without a known germline mutation in a pseudohypoxia-linked gene (Con, n = 29). (I) Cilia incidence in 33 PCC where more or less than 3% of cells labeled positively for Ki67. The number of cilia and nuclei were counted in 15 randomly selected fields for each sample. Mean axonemal length was quantified from at least 50 ciliated cells for each sample. Error bars indicate s.d. Statistical tests: t-test (B, C, E, F and I), ANOVA (G and H), linear regression (D). *P < 0.05, **P < 0.01, ***P < 0.001.

 This work is licensed under a