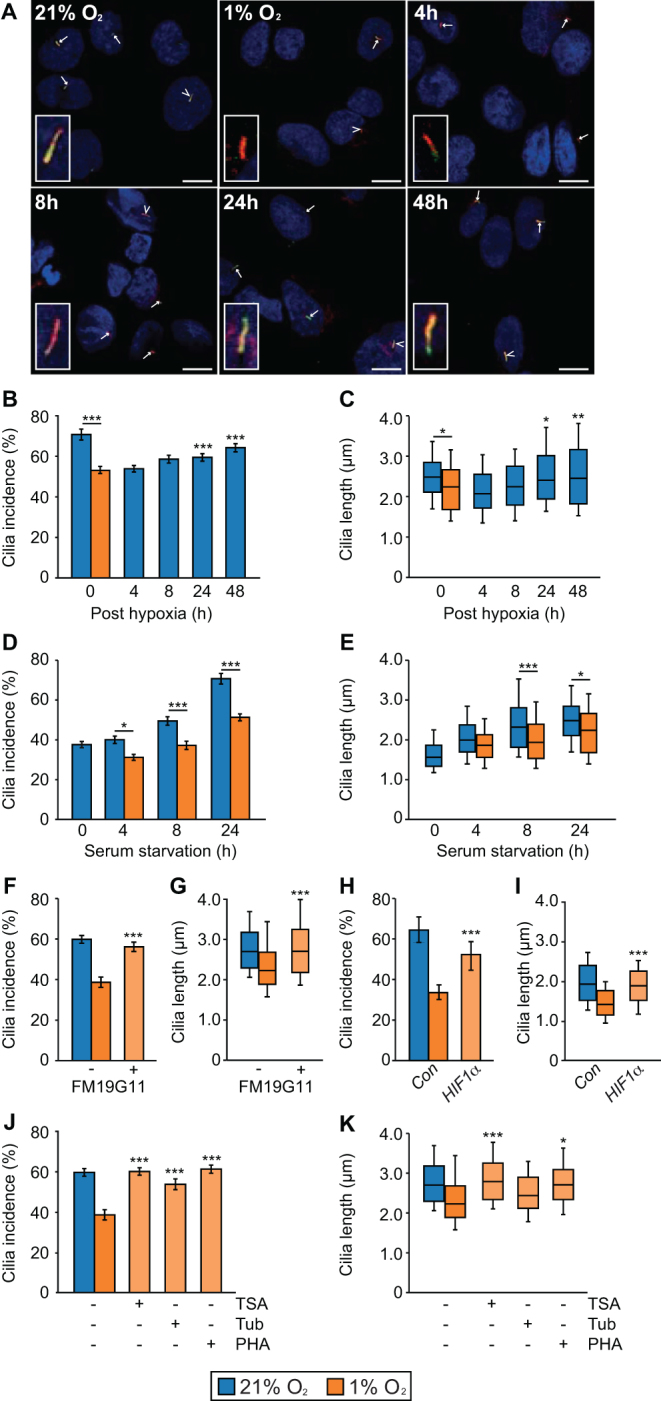
Figure 4.

Primary cilia are lost from PC12 cells when oxygen levels are reduced. (A) Confocal images of PC12 cells cultured in 21% or 1% oxygen for 24 h, prior to return to 21% oxygen for 4, 8, 24 or 48 h before processing for the detection of primary cilia as in Fig. 3A. Scale bars = 10 µm. (B and C) Quantification of primary cilia incidence (B) and axonemal length (C) after 24 hours of culture in 21% and 1% oxygen and subsequent recovery in 21% oxygen. (D and E) Comparison of primary cilia incidence (D) and axonemal length (E) upon serum starvation after culture in 21% or 1% oxygen. (F and G) Quantification of primary cilia incidence (F) and axonemal length (G) after 24 h of culture in 1% oxygen in the presence of the HIFα inhibitor FM19G11 or vehicle only control. (H and I) Quantification of primary cilia incidence (H) and axonemal length (I) after 24 h of culture in 1% oxygen in cells transfected with non-targeting control siRNAs or siRNA targeting HIF1α. (J and K) Quantification of primary cilia incidence (J) and axonemal length (K) after 24 h of culture in 1% oxygen in the presence of the inhibitors trichostatin A (TSA), tubacin, PHA-680632 or vehicle only control. Cilia scoring was performed in ten randomly selected fields for each experimental condition in three biological replicates. Mean axonemal length was quantified from at least 50 ciliated cells for each experimental condition. Error bars indicate 2× s.e.m. Box and whisker plots are as in Fig. 3. Statistical tests: ANOVA. *P < 0.05, **P < 0.01, ***P < 0.001.

 This work is licensed under a