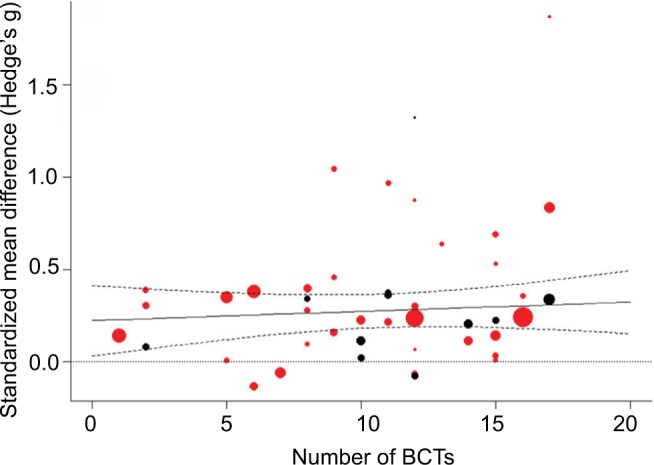
Figure 4.

Prediction of effect sizes by number of BCTs.
Notes: Solid line: predicted effect size of mixed-effects model; dashed lines: 95% confidence bounds; dotted line: reference line for null effect; bubbles: individual study effect sizes with size relative to inverse variance weight; red: subjective PA outcome; black: objective PA outcome.
Abbreviations: BCTs, Behavior Change Techniques; PA, physical activity.
