Figure 2.

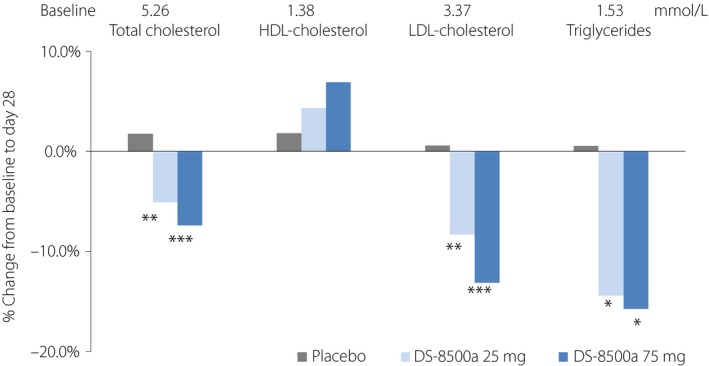
Change from baseline in total cholesterol, high‐density lipoprotein (HDL) cholesterol, low‐density lipoprotein (LDL) cholesterol and triglycerides at day 28 (full analysis set). *P < 0.05, **P < 0.01, ***P < 0.001 vs placebo, ancova.

Change from baseline in total cholesterol, high‐density lipoprotein (HDL) cholesterol, low‐density lipoprotein (LDL) cholesterol and triglycerides at day 28 (full analysis set). *P < 0.05, **P < 0.01, ***P < 0.001 vs placebo, ancova.