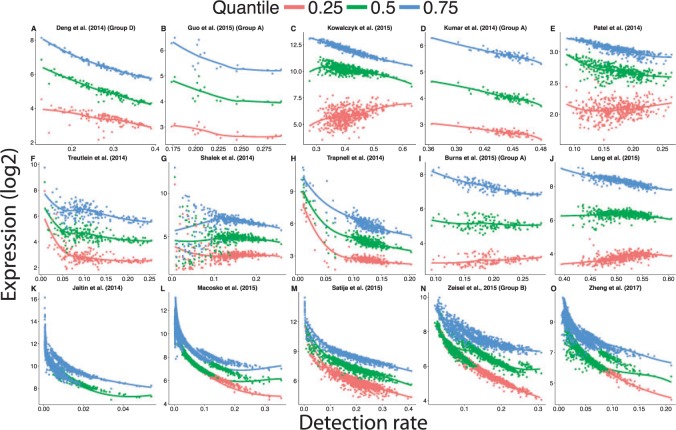
Fig. 4.
The distribution of gene expression changes with the detection rate using processed scRNA-seq data available on GEO. Failure to account for differences of the proportion of detected genes between cells over-inflates the gene expression estimates of cells with a low detection rate. The curves were obtained by fitting a locally weighted scatter plot smoothing (loess) with a degree of 1. Because the range of detection rate varied from study to study, the range of the x-axis differs across plots.

