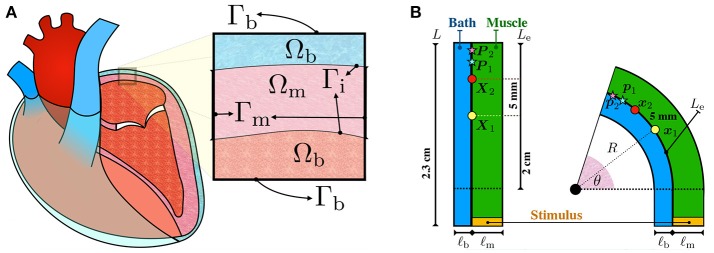
Figure 1.
(A) Schematic representation of the configurations of the muscle and blood bath. Inside the heart, blood acts as a low resistance conductor. Outside the heart, between the epicardium and the epicardial sac, an interstitial fluid can also act as a conductor. (B) Schematic representation of the idealized left atrial posterior wall. A rectangular strand of muscle (green) of length L = 2.3 cm and thickness ℓm is adjacent to an endocardial bath (blue) of thickness ℓb. The thickness of the muscle ℓm and of the bath ℓb are varied to study their influence on endocardial CVs. Curvature is applied to the top part of the rectangle such that the curved endocardial length Le is fixed at 2 cm. The corresponding curvature κ is defined as the inverse of the endocardial radius. The curvature is positive if the muscle is bent to the left and it is negative if it is bent to the right. Endocardial CVs are measured using the activation times at x1 (yellow circle) and x2 (red circle). In the straight geometry, x1 and x2 correspond to the points X1=(0 cm, 1 cm) and X2=(0 cm, 1.5 cm), fixed at distance 5 mm. As described by equation (7), endocardial CVs are defined as the distance between these two points divided by the difference of the respective activation times. Unipolar extracellular signals and are recorded at 1 kHz at p1 and p2, corresponding to the points P1=(0 cm, 1.75 cm) and P2=(0 cm, 1.95 cm) in the straight geometry. Bipolar signals were computed as the difference .

