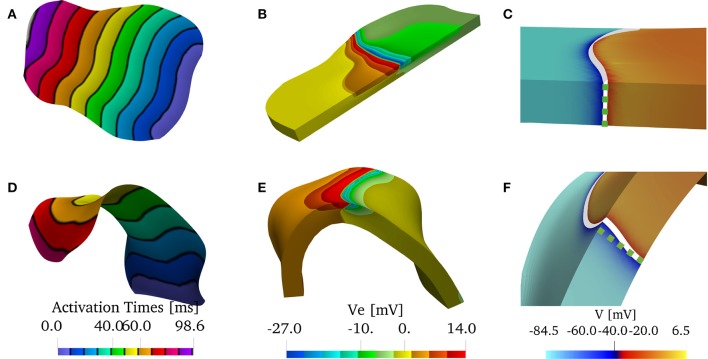
Figure 10.
(A–C) Solution on the flattened posterior wall. (D–F) Solution on the patient-specific left atrial posterior wall. (A,D) Comparison of the endocardial activation times for a muscle size of 1.5 mm and the bath size of 2.85 mm. The curved geometry has slower conduction velocities. (B,E) Comparison of the extracellular potential Ve at t = 40 ms. (C,F) Comparison of the wavefront when no bath is considered. The front in the curved geometry deviates from being straight through the thickness of the muscle. We show in the dashed green line the straight profile.

