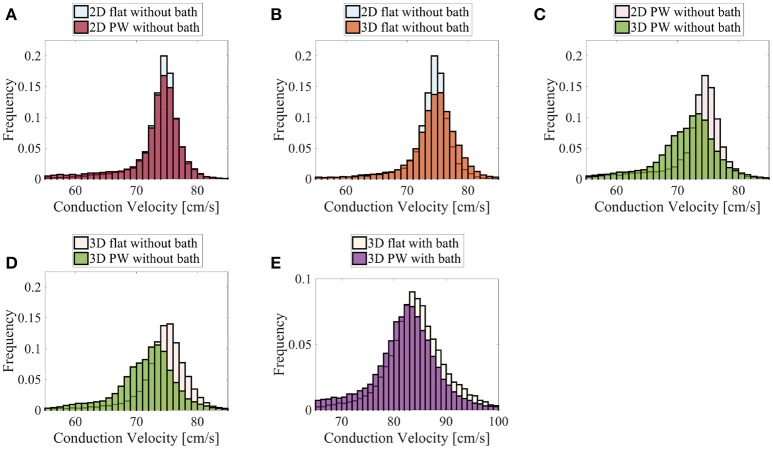
Figure 11.
Distributions of the nodal endocardial CVs for the patient-specific LAPW. Simulations were run considering 2D (neglecting thickness) and 3D representations of the posterior wall (PW). To investigate the role of curvature, simulation were run on a flattened version of the posterior wall (flat). We also considered the case the of intracardiac bath-loading conditions (bath). The 2D simulations resulted in very similar distributions (A), where the most frequent conduction velocities are around 74–76 cm/s. The conduction velocity distributions are also very similar when one considers a 2D and 3D flattened posterior wall (B). On the contrary, in the actual curved posterior wall, the thickness of the tissue influences the distributions of the conduction velocities: the thickness of the muscle leads to a broader distribution of slower conduction velocities (C). Similarly, the broader distribution of slower conduction velocities can be noted comparing the thick flattened and the actual posterior wall simulations (D). When the bath is added to the simulation (E) the endocardial conduction velocities are substantially increased and the differences between the curved and the flattened geometries are reduced although they can still be appreciated.

