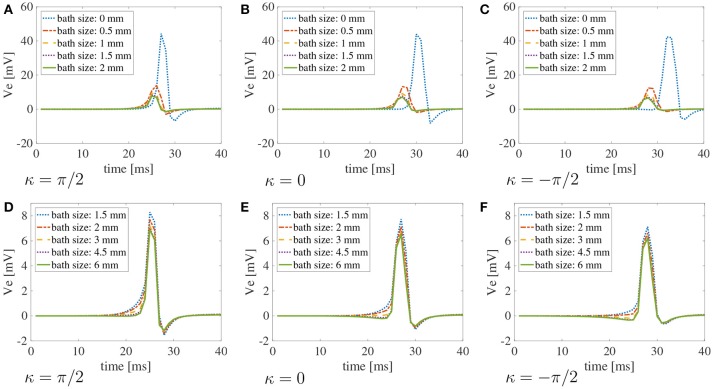
Figure 9.
Bipolar signals recorded at 1 kHz for three selected curvatures κ = π/2 cm−1, 0 cm, π/2 cm−1 for different bath sizes and muscle thickness ℓm = 1.5 mm using the modified version of the Courtemanche atrial ionic model. (A–C) Bipolar signals for bath sizes between 0 and 2 mm. (D–F) Bipolar signals for bath sizes between 1.5 and 6 mm. An overlap of the data has been used between the top and bottom rows to better understand the differences in signals for different bath sizes. The curvature of the domain does not play a major role in the recorded signals. Large differences in the signal amplitudes can be found for bath sizes smaller than 2 mm. Although minor differences can also be noted for bath larger than 1.5 mm, the amplitude of the signals is well captured for baths of size at least 3 mm.

