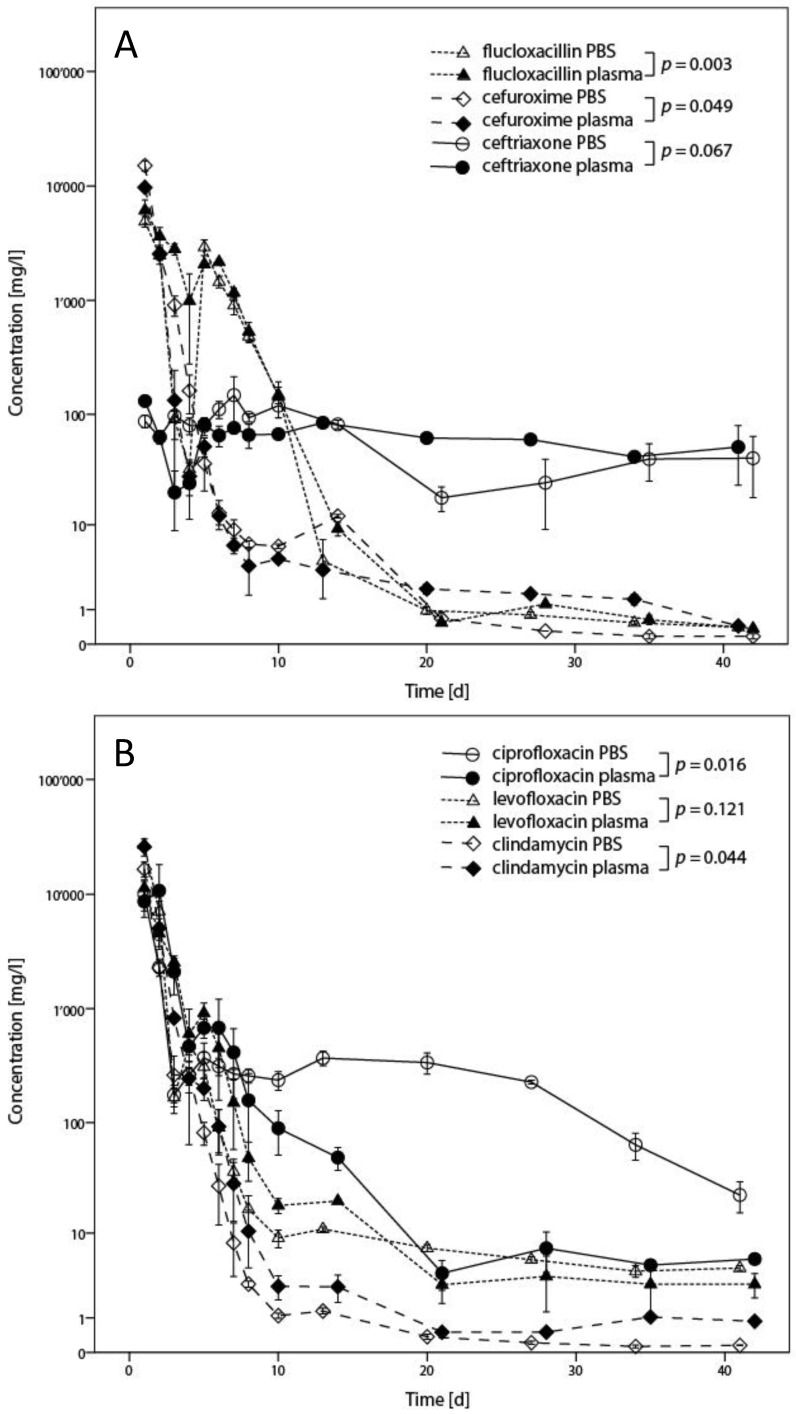
Figure 3.
Results from determination of concentration in the elution fluids by HPLC-MS indicated for both PBS and plasma. In Fig. 3A, results for flucloxacillin, cefuroxime, and ceftriaxone are presented. Fig. 3B shows the results for ciprofloxacin, levofloxacin and clindamycin. Results are presented as means from triplicates with error bars indicating standard deviation, with statistical analysis of the comparison between results in PBS and plasma indicated in the legend.

