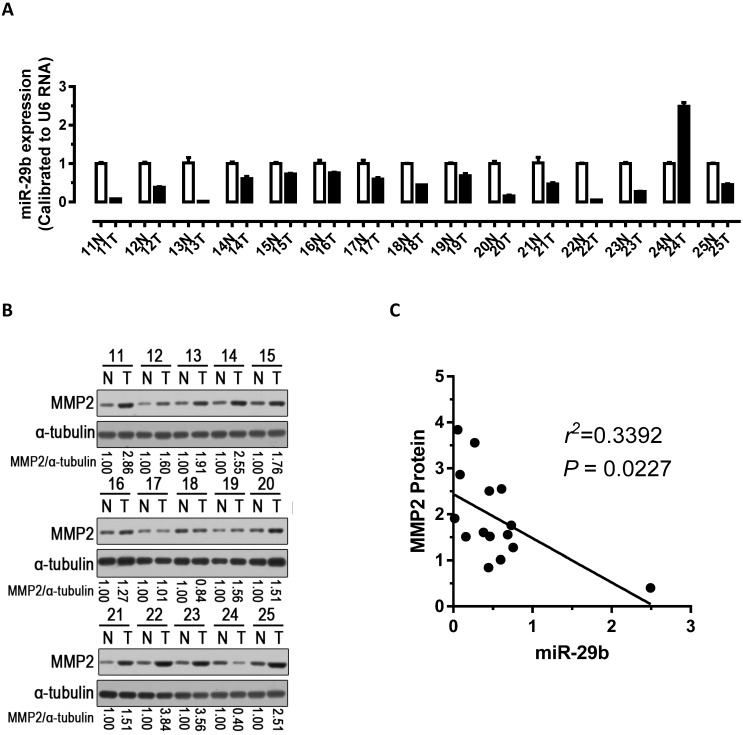
Figure 4.
Analysis of miR-29b and MMP2 expression in GC samples. (A) miR-29b expression was significantly down-regulated in human GC tissues. (B) Western blot demonstrating the protein expression level of MMP2 in GC tissues. (C) Inverse correlation between the expression of miR-29b and the expression of MMP2 protein in 15 pairs of GC clinical samples. Abbreviations: T, GC tissue; N, adjacent noncancerous gastric tissue; U6 mRNA were calibrated for qPCR analysis; α-tubulin was used as a control for protein loading.

