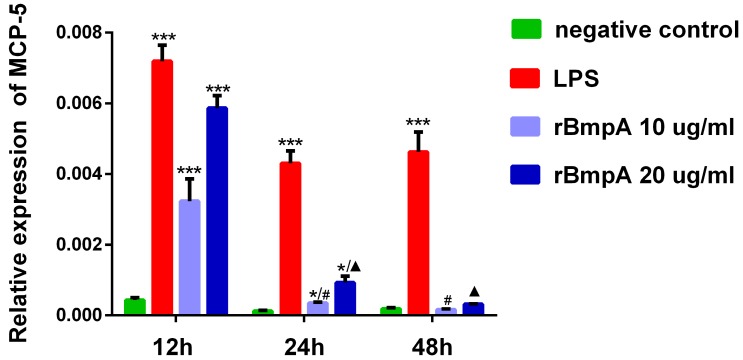
Figure 1.
The relative expression of CCL12 (MCP-5) mRNA in mouse macrophage RAW 264.7. Notes: * Indicates a significant difference from the negative control in the same times. * P<0.05, ** P<0.01, *** P<0.001 #Indicates a significant difference when compared with 10μg/ml rBmpA group at 12h time point. #P<0.05, # #P<0.01, # # #P<0.001 ▲ Indicates a significant difference when compared with 20μg/ml rBmpA group at 12h time point. ▲P<0.05, ▲▲ P<0.01, ▲▲▲ P<0.001

