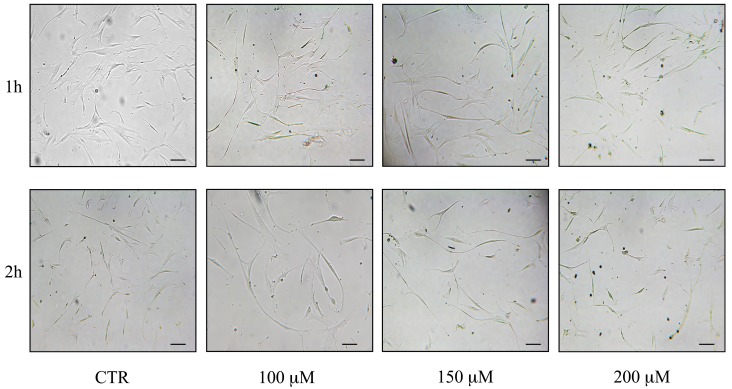
Figure 10.
Morphological changes of hASCs after reseeding post H2O2 treatments: control (CTR) cells and cells treated with H2O2 100, 150 and 200 μM. Cells were analyzed under a light microscope (at 200× magnification) and cell images were detected under bright field illumination with the Leica MC170 HD Imaging System. Scale bars: 100 μm.

