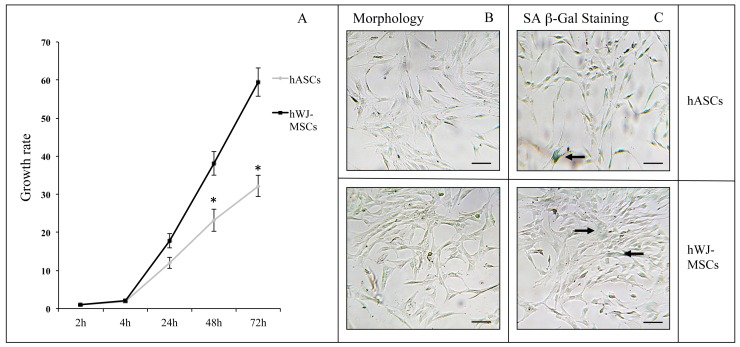
Figure 2.
(A) Cell proliferation and senescence in hASCs and hWJ-MSCs: growth rate of hASCs (n=4) and hWJ-MSCs (n=4) expressed as mean ± standard error of the mean (SEM; *p<0.05). Typical hASC and hWJ-MSC morphology at 9th - and 8th culture passages respectively (B), and SA β-Gal staining in hASCs and hWJ-MSCs (C). Cells were analyzed under a light microscope and cell images were detected under bright field illumination with the Leica MC170 HD Imaging System at 200× magnification. Scale bars: 100 μm. Representative blue cells, as markers of senescence, are indicated by black arrows.

