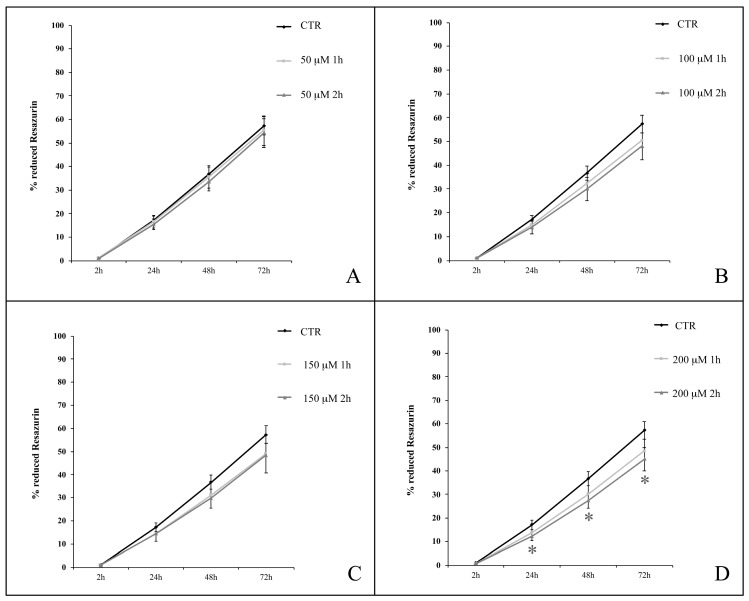
Figure 6.
hWJ-MSC proliferation curves after treatment with H2O2 at concentrations of 50 μM (A), 100 μM (B), 150 μM (C) and 200 μM (D) for 1 or 2 h. Analysis was conducted at 2, 24, 48, 72 h from the end of the treatment; data are expressed as mean of percentage of reduction of Resazurin (n=4, culture passages 6th- 16th) ± SEM, *p<0.05. CTR is control.

