Figure 9.
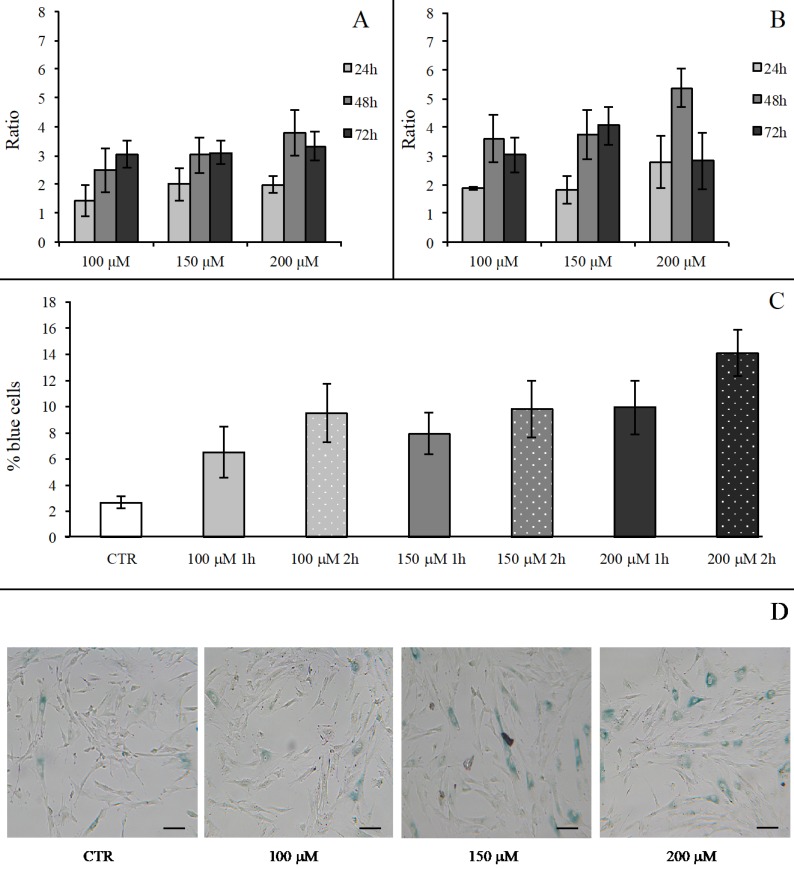
hWJ-MSC SA β-Gal activity after H2O2 treatment. Effect of H2O2 treatment expressed in term of ratio between the percentage of blue cells in treated sample and the relative percentage of blue cells in untreated sample after 1 h (Panel A) and 2 h (Panel B) of treatment. In each panel the effect of every H2O2 concentration was presented after 24, 48 and 72 h from the end of the stimulus. Data were obtained in triplicate from one subject and expressed as ratio (n=3) ± SD. Control value is 1 (not shown) and treatment was arbitrarily considered effective when ratio was >3. In Panels (C) and (D) the effects of different H2O2 concentrations on hWJ-MSC SA β-Gal activity tested at 48 h from the end of the treatment are shown. In Panel (C), a graph representative of three (obtained from three different subjects) showing the percentage of blue cells in untreated (CTR) and treated cells after 1 and 2 h of H2O2 treatment. Data were expressed as percentage of blue cells ± SD. Panel (D): representative SA β-Gal staining images of hWJ-MSCs untreated (CTR) and treated with H2O2 at final concentrations of 100 μM, 150 μM and 200 μM after 2-h treatment. Cells were analyzed under a light microscope (at 200× magnification) and cell images were detected under bright field illumination with the Leica MC170 HD Imaging System. Blue staining indicates senescent cells and scale bars correspond to 100 μm.

