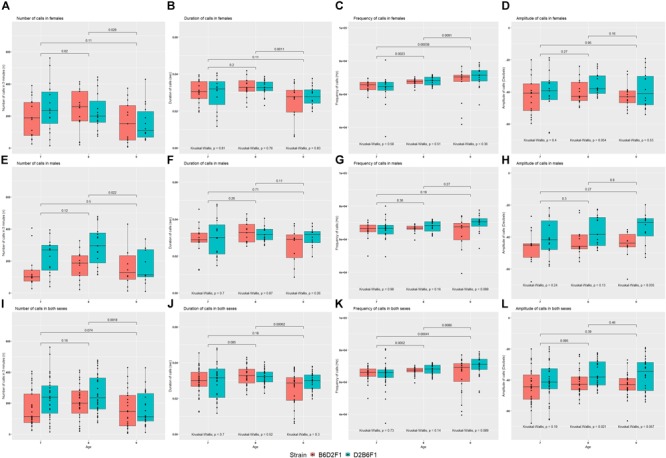
FIGURE 4.

Mean values for the four quantitative traits in females (A–D), males (E–H) and combined both sexes (I–L) of the reciprocal F1 cross (B6D2F1 and D2B6F1). Between day comparisons were calculated using the Wilcox test and are shown at the top of each plot, whereas comparisons between strains were calculated by the Kruskal–Wallis test and are shown at the bottom of each plot.
