FIGURE 7.

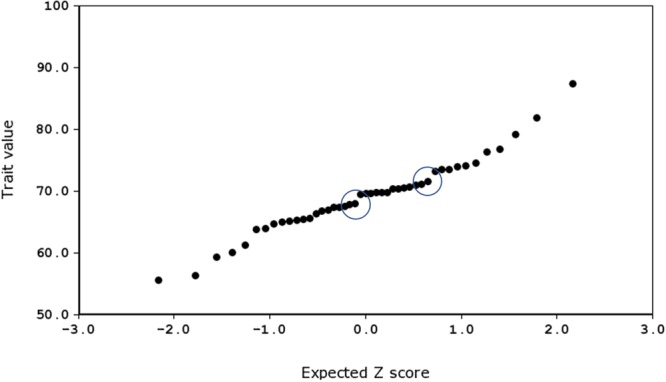
Normal probability plot for frequency of call on day 7, produced using GeneNetwork.org (Trait ID 16359). The two ‘jumps’ representing major effect loci are circled.

Normal probability plot for frequency of call on day 7, produced using GeneNetwork.org (Trait ID 16359). The two ‘jumps’ representing major effect loci are circled.