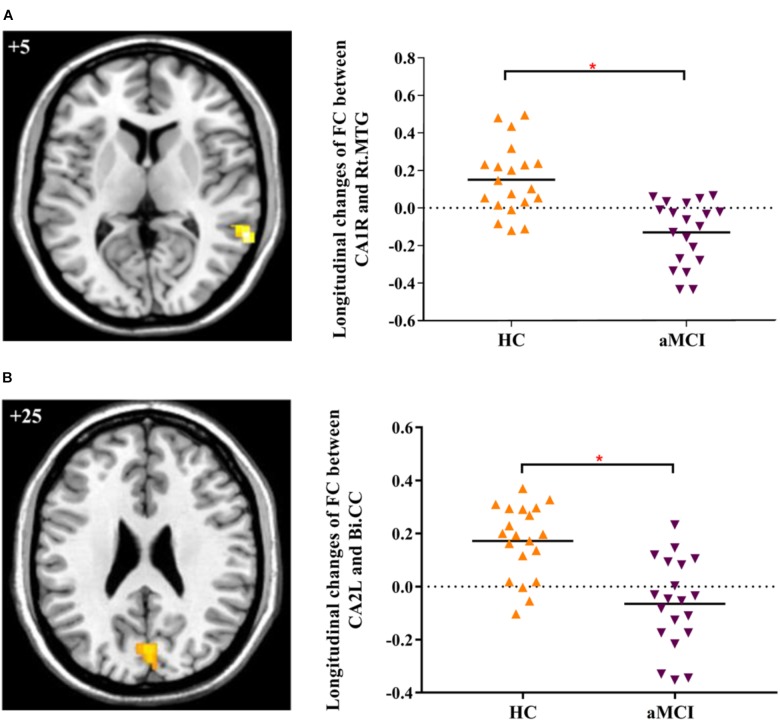
FIGURE 1.
(A) Decreased FC between right CA1 and right MTG in aMCI subjects as compared to HC at follow-up vs. baseline (interaction effect); (B) Decreased FC between left CA2 and bilateral CC in aMCI subjects as compared to HC group at follow-up vs. baseline (interaction effect). Numbers in the figure indicate the Z coordinate in MNI space; FC, functional connectivity; CA1R, the right cornu ammonis 1; CA2L, the left cornu ammonis 1; Rt., right; Bi., bilateral; MTG, middle temporal gyrus; CC, cuneal cortex; ∗indicates cluster level p < 0.05, FWE corrected.

