
Figure EV2. Cells from E11.5 and E15.5 cluster together.
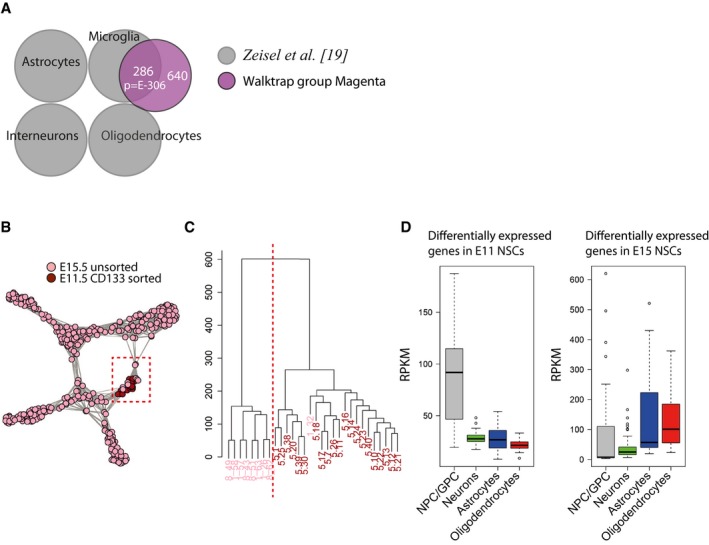
- Differentially expressed genes from Walktrap cell cluster colored by magenta significantly overlap with genes expressed in microglial cells from adult mouse brain 19. P‐values (phyper, R) are calculated from the total number of genes for mm10 (23,389).
- t‐SNE graph of cells from scRNA‐seq that were colored according to their developmental stage. Cells from E11.5 and E15.5 spinal cords were similar enough to cluster together (a Walktrap cell cluster defined as NPC/GPC, marked by red box).
- Histogram graph of cells from the NPC/GPC Walktrap cell cluster. Cells were divided into two major clusters through hclust software (R), which were highly overlapping to the developmental stages of the cells (pink E11.5; red E15.5).
- Genes that were significantly higher expressed in E11.5 progenitor cells compared to E15.5 progenitor cells were genes expressed in NPC/GPC. Genes that had increased expression in E15.5 cells were instead genes expressed in the NPC/GPC, astrocytes, and oligodendrocytes. In the boxplots, all genes expressed at RPKM > 1 are shown and include therefore genes expressed in more than one cell type. Boxplot whiskers show 1.5 IQR of highest and lowest quartile, outliers are included (dots). n = 194 for NPC/GPC, 1309 for neurons, 434 for astrocytes, and 301 for oligodendrocytes.