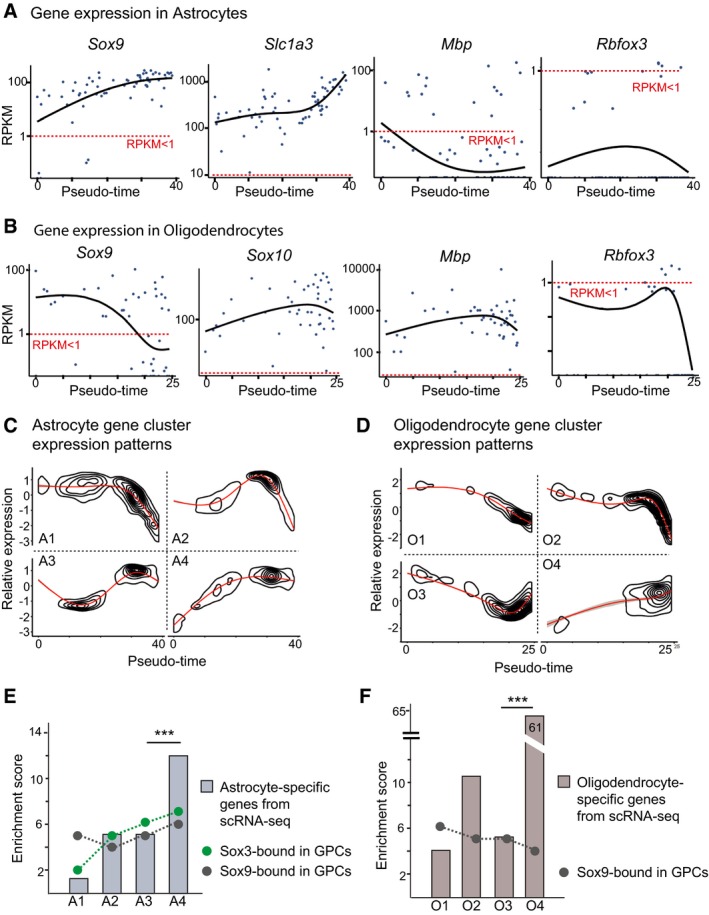
Sox9, Slc1a3, Mbp, and Rbfox3 expression in astrocytes that have been arranged according to a pseudotemporal order. Dashed lines denote threshold levels RPKM = 1.
Sox9, Sox10, Mbp, and Rbfox3 expression in oligodendrocytes that have been arranged according to a pseudotemporal order. Dashed lines denote threshold levels RPKM = 1.
4,000 randomly selected genes expressed in astrocytes (threshold RPKM > 2) were clustered into four groups (A1–A4) according to their expression patterns along the pseudotime axis.
4,000 randomly selected genes expressed in oligodendrocytes (threshold RPKM > 2) were clustered into four groups (O1–O4) according to their expression patterns along the pseudotime axis.
Enrichment of astrocyte‐specific genes (from scRNA‐seq) and genes bound by SOX3 and SOX9 in GPCs in the four different astrocyte gene clusters (A1–A4), shown in panel (C). Three‐star significance equals P‐value e‐13 (prop.test, R) based on the size of the gene groups (A1 = 740, A2 = 1,019, A3 = 882, A4 = 1,236).
Enrichment of oligodendrocyte‐specific genes (from scRNA‐seq) and genes bound by SOX3 and SOX9 in the four different oligodendrocyte gene clusters (O1–O4), shown in panel (D). Three‐star significance equals P‐value e‐16 for cluster O4 (prop.test, R) based on the size of the gene groups (O1 = 1,371, O2 = 1,451, O3 = 839, O4 = 141).