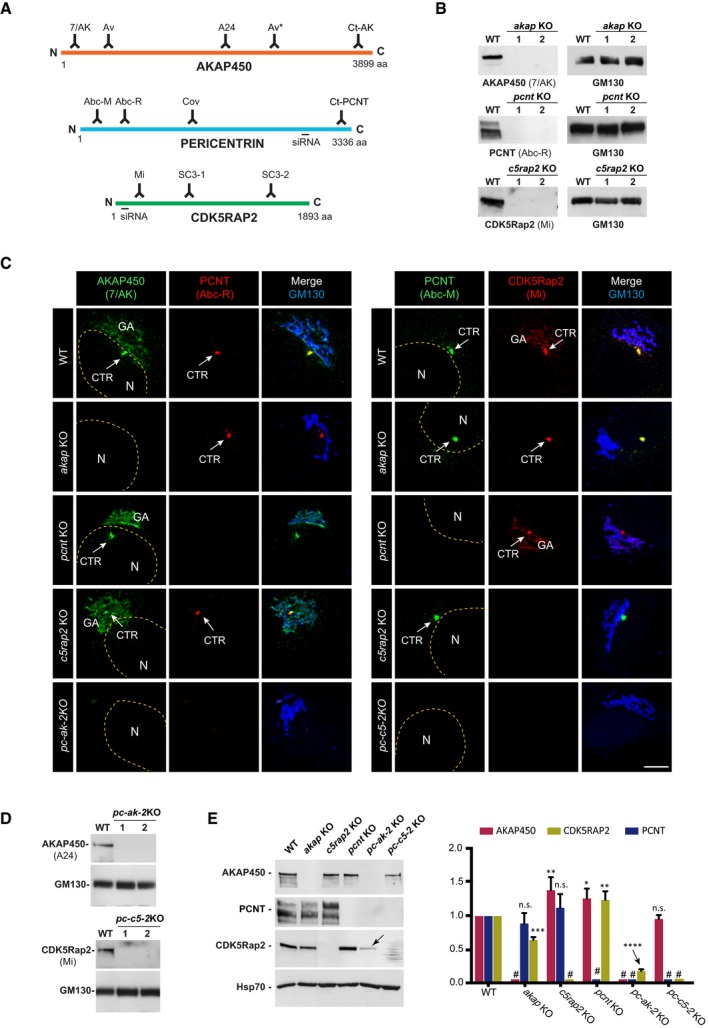
Schematic representation of AKAP450, PCNT, and CDK5Rap2 proteins illustrating localization of the epitopes recognized by the antibodies and the sequences targeted by the siRNAs used in this study.
Representative WBs of RPE‐1 wild‐type (WT) cells and the two selected KO clones for AKAP450 (akap KO), PCNT (pcnt KO), and CDK5Rap2 (c5rap2 KO) probed with the indicated antibodies.
Confocal IF images of RPE‐1 WT, single KO (akap KO, pcnt KO, and c5rap2 KO), and double KO (pc‐ak‐2KO, left panels; pc‐c5‐2KO, right panels) cells stained with the indicated antibodies. The yellow dashed line indicates the nucleus contour, (N) and the arrows point the centrosome (CTR). GA marks the Golgi apparatus. Scale bars: 5 μm.
Representative WB of RPE‐1 WT cells and the two selected PCNT/AKAP450 (pc‐ak‐2KO) and PCNT/CDK5Rap2 (pc‐c5‐2KO) double knock‐out‐mutated clones probed with the indicated antibodies.
Representative WB of RPE‐1 WT cells and the indicated single or double KO cell lines probed with anti‐AKAP450, PCNT, and CDK5Rap2 antibodies (left). Quantification of signal intensity from three independent WB experiments is shown at right. # indicates KO proteins. The arrow points the dramatic decrease in CDK5Rap2 levels in pc‐ak‐2KO cell line. Bars represent mean values ± standard deviation (SD) of three independent experiments.
Data information: GM130 was used as a loading control in (B and D). Hsp70 was used as a loading control in (E). For statistical analysis, we used one‐way ANOVA followed by Dunnett's multiple comparisons test. *
< 0.0001; n.s., non‐significant.