-
A, B
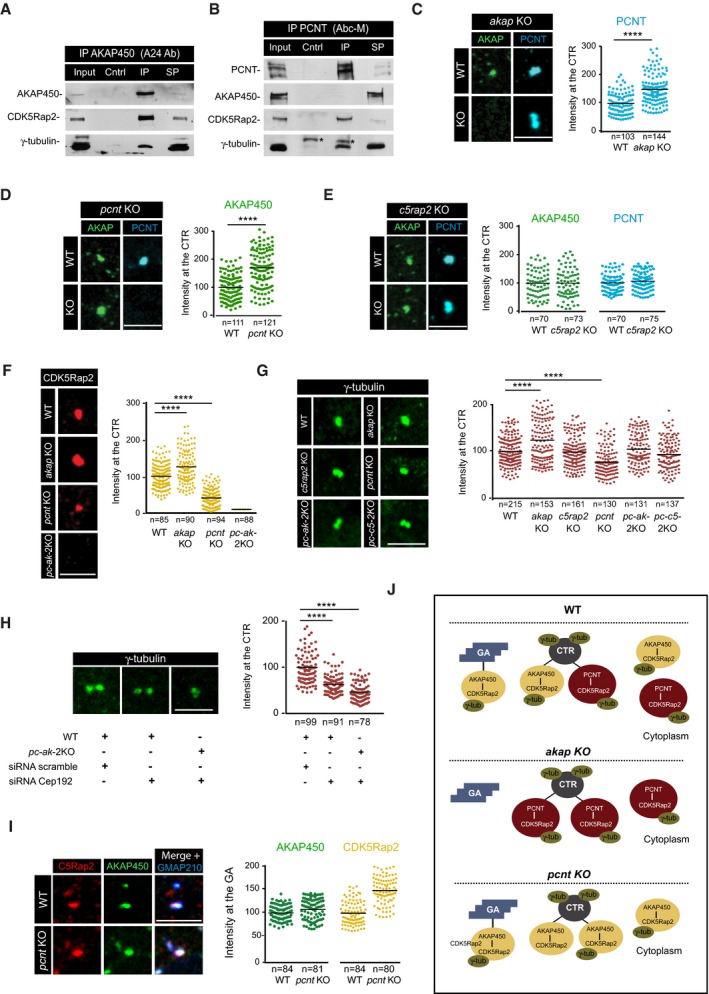
WB of AKAP450 (A) and PCNT (B) co‐immunoprecipitation assays revealed with the indicated antibodies. Asterisks mark immunoglobulin heavy chains. Cntrl, non‐specific Igs immunoprecipitates; IP, specific Igs immunoprecipitates; SP, supernatant.
-
C–G
(Left) Centrosomes from WT, single, and double KO cells, as indicated, were labeled for AKAP450 and PCNT (C–E), CDK5Rap2 (F), and γ‐tubulin (G). Right panels show quantifications. A region of interest of 1.5 μm radius was drawn around the centrosome, and fluorescence intensity was determined and normalized to WT mean.
-
H
WT and pc‐ak‐2KO cells were transfected with either scramble or CEP192 siRNAs, fixed, and stained for γ‐tubulin. Quantification of the fluorescence intensity is shown at right.
-
I
IF images of WT and pcnt KO RPE‐1 cells treated with NZ for 3 h and triple‐stained for AKAP450 (green), CDK5Rap2 (red), and GMAP210 as a Golgi marker (blue). At right, quantification of fluorescence co‐localization of either AKAP450 or CDK5Rap2 with the Golgi marker GMAP210 in WT and pcnt KO cells.
-
J
Scheme summing up the changes in AKAP450‐based and PCNT‐based complexes distribution in WT, akap KO, and pcnt KO RPE‐1 cells and their impact on γ‐tubulin recruitment. GA, Golgi apparatus. CTR, centrosome.
Data information: Data were collected from three independent experiments except for (E and I), which are based on two independent experiments, and normalized to WT mean. For statistical analysis (C–H), we used one‐way ANOVA followed by Dunnett's multiple comparisons test, and for statistical analysis of (J), two‐tailed Student's
t‐test was employed. ****
P < 0.0001. Scale bars, 5 μm.
Source data are available online for this figure.