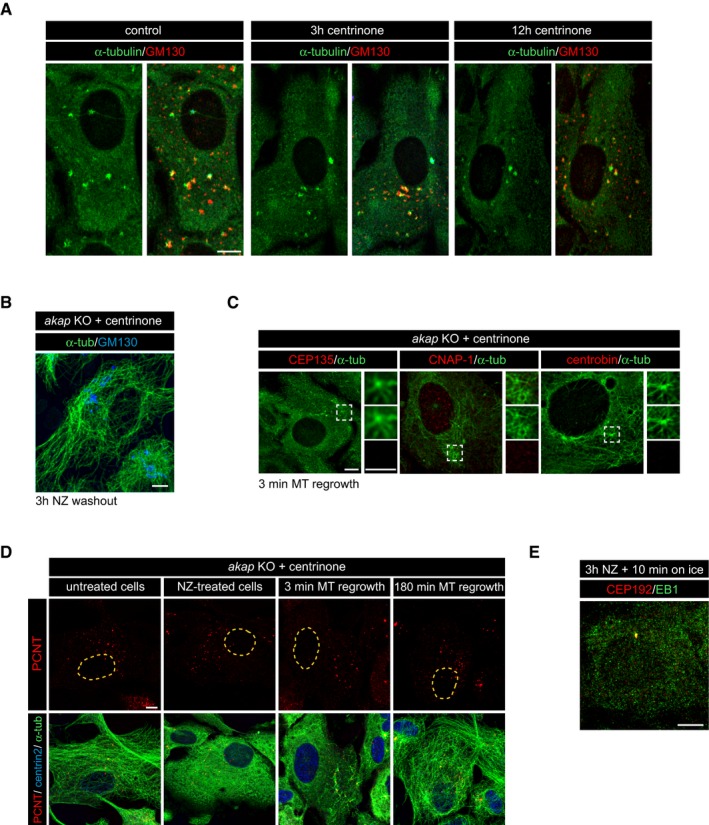
Non‐treated, 3‐h centrinone‐treated or 12‐h centrinone‐treated RPE‐1 cells were subjected to a MT regrowth assay, fixed 3 min after drug washout, and double‐labeled for α‐tubulin and GM130.
Complete MT network recovery of akap KO centriole‐less centrinone‐treated cells 3 h after removal of NZ. Cells were stained with anti‐α‐tubulin and anti‐GM130 antibodies.
Centrinone‐treated akap KO cells were subjected to a MT regrowth assay and double‐stained with the indicated antibodies. High magnifications of the boxed areas are shown as merged images (top) or as individual green or red labelings (middle and bottom panels).
Centrinone‐treated akap KO cells were treated with NZ and, at the indicated time points after NZ washout, fixed, and labeled for α‐tubulin (green), PCNT (red), and centrin 2 as a centrosomal marker (blue). Single labeling images for PCNT are shown at the top and the corresponding merged images at the bottom.
RPE‐1 cells treated with NZ for 3 h and incubated for 10 min on ice after NZ removal were double‐labeled for EB1 and CEP192. No EB1 signal was visible throughout the cytoplasm demonstrating the complete depolymerization of MTs under these conditions.
Data information: Scale bars: 5 μm (except in A, scale bar: 7.5 μm).