
Figure 5. Redistribution of γ‐TuRC‐binding factors to the GA in the absence of the centrosome.
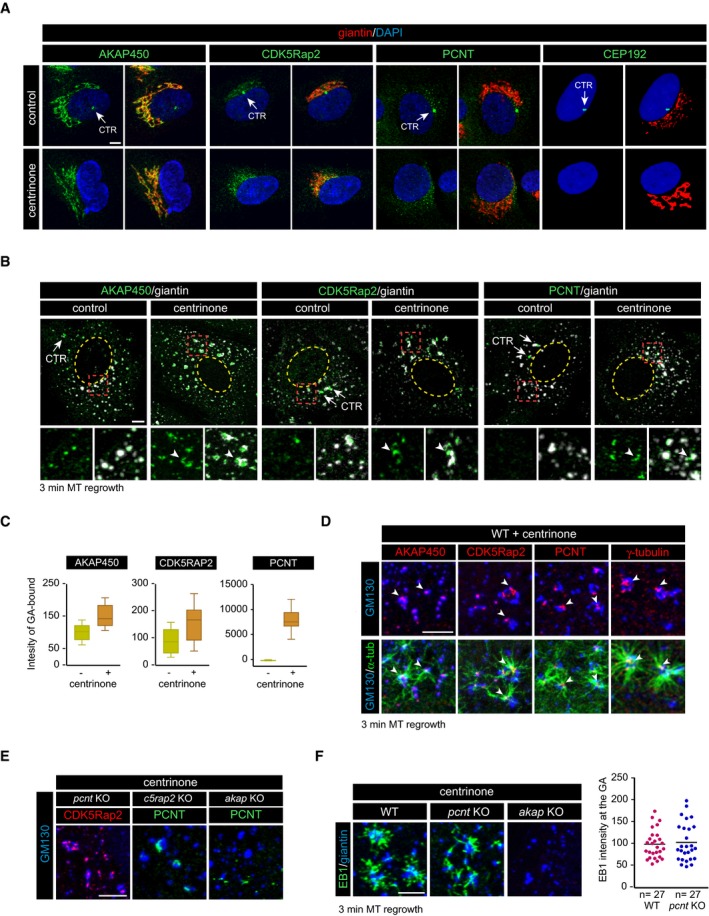
- Control (top) and centrinone‐treated (bottom) RPE‐1 cells double‐stained for either AKAP450, CDK5Rap2, PCNT, or CEP192 (all shown in green) and giantin (red) as a Golgi marker. DNA was counterstained with DAPI and is shown in blue. Single‐channel (left, green) and merged images (right) are shown in each case. White arrows indicate the centrosome (CTR).
- IF images of control and centrinone‐treated RPE‐1 cells treated with NZ to induce GA fragmentation and double‐stained with either anti‐AKAP450, anti‐CDK5Rap2, or anti‐PCNT (all shown in green) and anti‐giantin antibodies (white). Enlarged views of the boxed areas are presented at the bottom with or without the signal of the Golgi marker. The yellow dashed line indicates the contour of the nucleus. Arrowheads point to the accumulation of the respective proteins in Golgi membrane surfaces.
- Box‐and‐whisker plots showing quantification of association between the indicated protein and Golgi elements (see Materials and Methods for details). Top and bottom ends of the boxes represent 75th and 25th percentiles, and whiskers represent 90th and 10th percentiles. The median is depicted with a solid line. Individual Golgi elements from at least 14 cells were delineated (> 500 elements/experiment), and the intensity of each protein spot associated with each Golgi element was measured. Data were collected from two independent experiments and normalized to WT mean.
- MT regrowth experiment after NZ treatment in centrinone‐treated cells. High‐magnification images at the bottom are representative of a triple staining with α‐tubulin (green), GM130 (blue), and the indicated protein (red) and show MTs growing from the surface of the GA. Double labeling without α‐tubulin is also shown (top) to allow better visualization of PCM‐protein spots on Golgi elements acting as MT nucleation sites (arrowheads).
- Centrinone‐treated pcnt KO, c5rap2 KO, and akap KO cells were incubated with NZ for 3 h, fixed, and double‐labeled for GM130 and either CDK5Rap2 or PCNT as indicated (n = 3).
- MT regrowth assay in centrinone‐treated WT, pcnt KO, and akap KO RPE‐1 cells stained with antibodies to EB1 and giantin. At right, quantification of EB1 intensity at the Golgi membranes in WT and pcnt KO cells treated with centrinone, as a measure of MT nucleation from the GA. Data were collected from two independent experiments and normalized to WT mean.