-
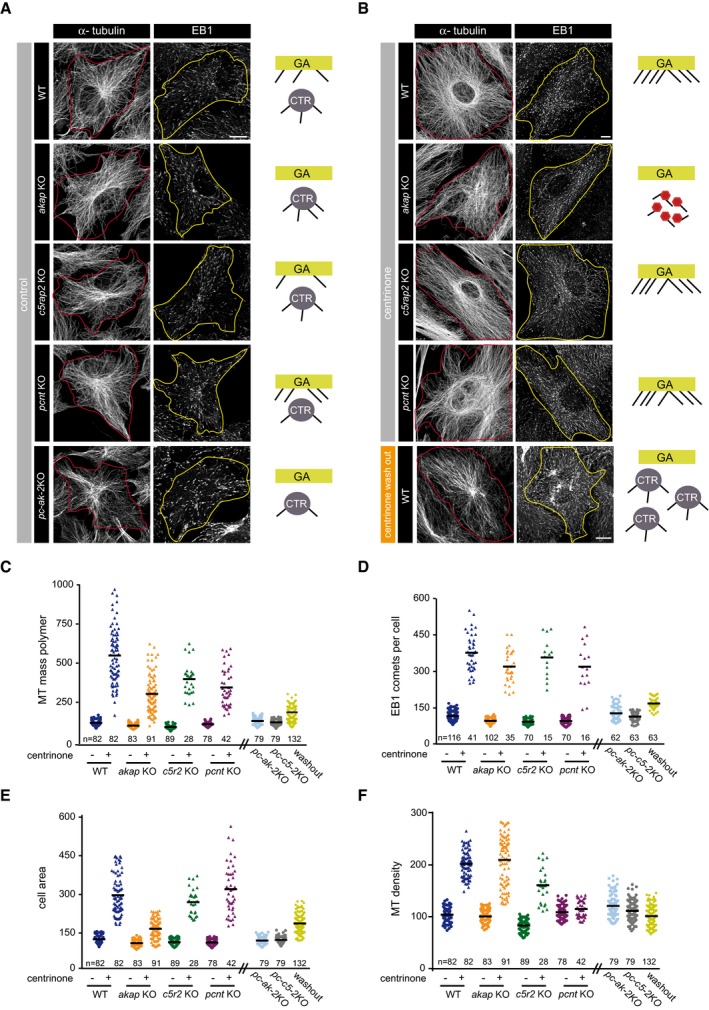
A
Confocal images showing MT network in WT, akap KO, c5rap2 KO, pcnt KO, and pc‐ak‐2KO RPE‐1 cells fixed and stained with antibodies against α‐tubulin (left) or EB1 (right). The red and yellow lines indicate the contour of cells. A schematic representation of active MTOCs is shown in each case. GA, Golgi apparatus; CTR, centrosome.
-
B
Same as in (A), but in centrinone‐treated WT, akap KO, c5rap2 KO, and pcnt KO backgrounds. Cells containing extra centrosomes induced by centrinone washout were also quantified (bottom panels).
-
C–F
Quantification of α‐tubulin fluorescence intensity (as a measure of MT mass polymer; C), number of EB1 comets per cell; (D), cell area; and (E), MT density (MT mass polymer/cell area; F) in control and centrinone‐treated WT, akap KO, c5rap2 KO, and pcnt KO cells. Non‐centrinone‐treated double KO cells and centrinone‐treated WT cells after washout were also included. Scatter plots show each individual data point, and horizontal black lines bars represent the mean.
Data information: Scale bars, 10 μm. Data were collected from three independent experiments and normalized to the untreated WT control. Statistical analysis is shown in Fig
D.