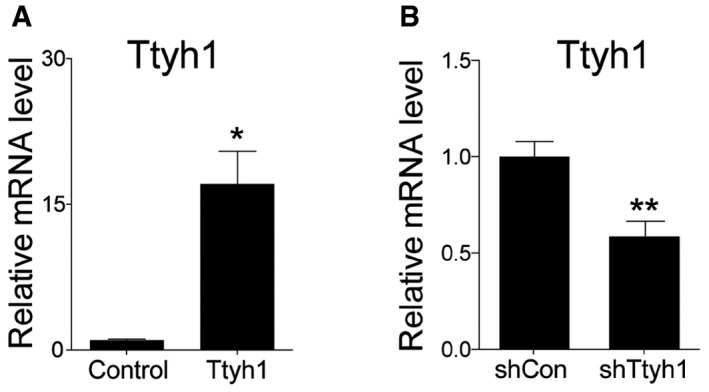
Figure EV1. mRNA levels of Ttyh1 after gene manipulation in primary mouse neural progenitor cells in vitro .

-
A, BTwo days after E14.5 primary neural progenitor cells were transduced with retroviral vectors expressing (A) Ttyh1 or (B) shTtyh1, mRNA expression levels of Ttyh1 were measured by qPCR. Error bars represent SD. Student's t‐test was used to determine statistical significance. *P < 0.05, **P < 0.01, n = 3 for (A), n = 4 for (B).
