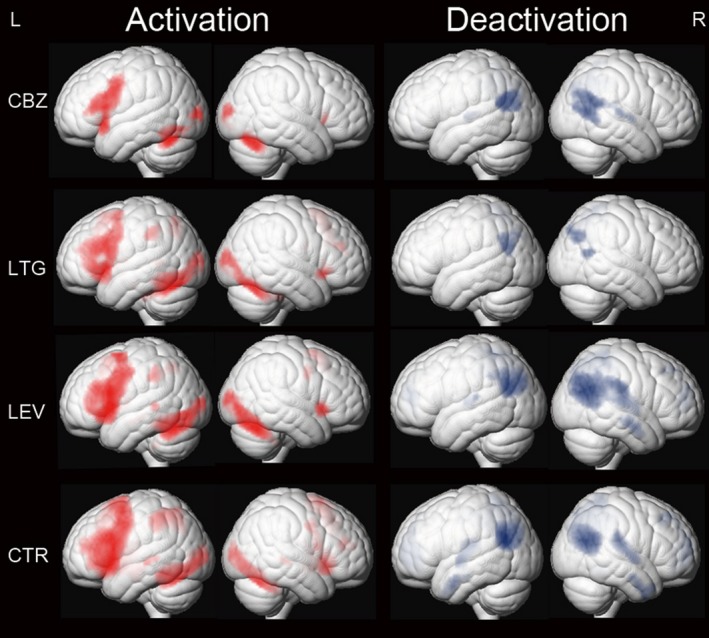
Figure 1.

One‐sample t tests of functional magnetic resonance imaging activation and deactivation maps for the 3 different patient groups on carbamazepine (CBZ), levetiracetam (LEV), and lamotrigine (LTG) and healthy controls (CTR) are demonstrated on a surface‐rendered brain template. Task‐relevant regions (red) include bilateral inferior and middle frontal gyrus (left > right), bilateral supplementary motor area, the left dorsolateral parietal region, and bilateral inferior occipital lobes. Areas of task‐related deactivations (blue) include the bilateral precuneus, posterior cingulate, angular gyrus, and medial prefrontal and lateral temporal cortex. P < .005, 20‐voxel threshold extent. L, left; R, right
