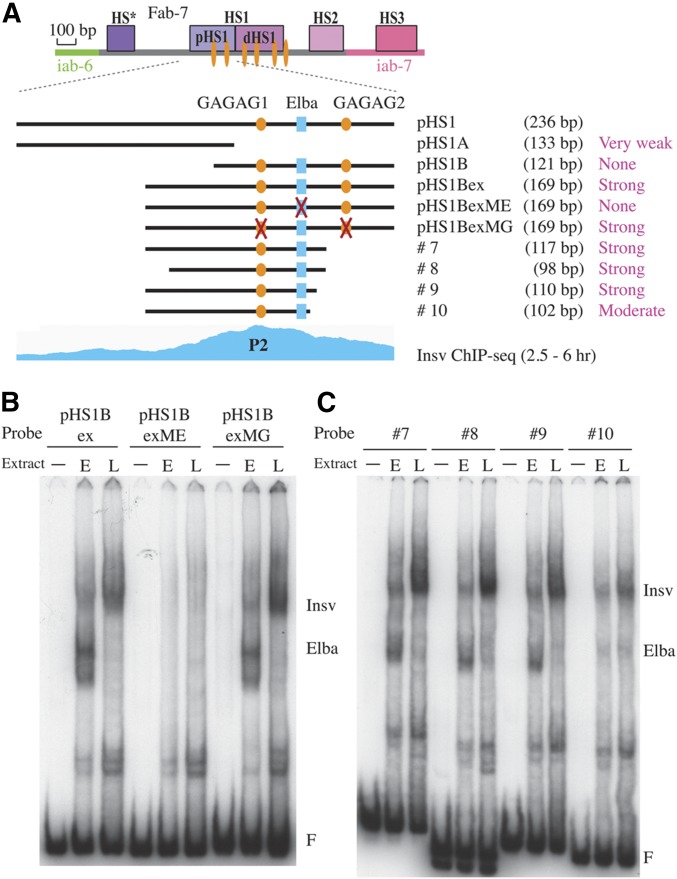
Figure 6.
Electrophoretic mobility shift assay (EMSA) of probes spanning P2. (A) Diagram of probes spanning P2. Indicated are the extent of the probes, their length, and relative binding affinity for Insv. Also indicated are recognition sequences for GAF (GAGAG, orange ovals) and Elba (CCAATAAG, blue rectangle). The Insv chromatin immunoprecipitation-sequencing (ChIP-seq) diagram of early embryos (Dai et al. 2015) is aligned on the bottom. (B) EMSA of wild-type pHS1Bex (A) and mutated versions of pHS1Bex. pHS1BexME, mutation of the Elba sequence; pHS1BexMG, mutation of both GAGAG sequences). (C) EMSA of probes #7, #8, #9, and #10. The location and extent of these four probes is indicated in (A). (F) free probe. Positions of the Elba and Insv shifts are indicated. − no extract; E, 0–6 hr “early” embryo nuclear extract; L, 6–18 hr “late” embryo extract.

