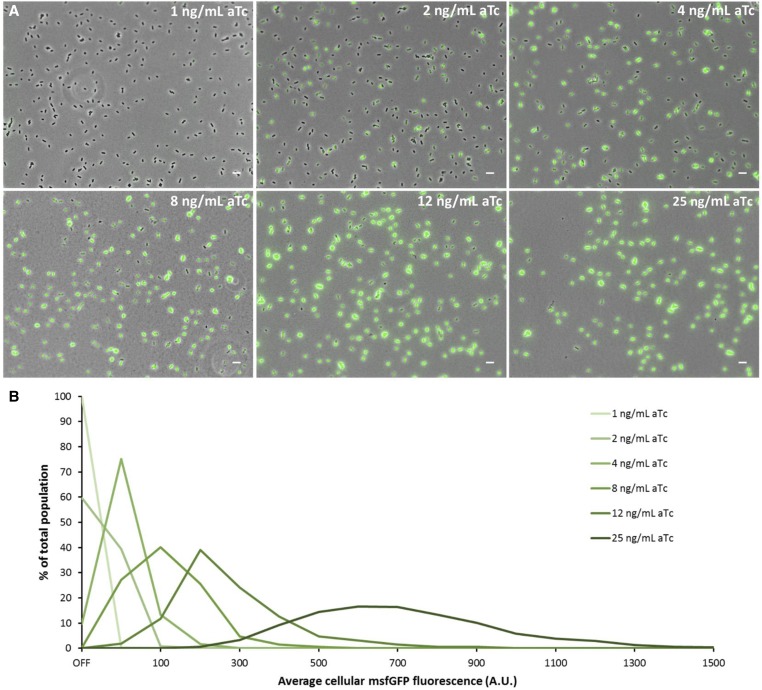
Figure 3.
SpvR determines the proportion of spvA ON cells and the intensity of spvA expression. (A) Representative images (overlay of phase contrast and GFP channels) of the S. typhimurium ATCC14028s PLtetO-1-spvR_spvA-msfGFP strain grown overnight in ISM containing 1 ng/ml aTc, 2 ng/ml aTc, 4 ng/ml aTc, 8 ng/ml aTc, 12 ng/ml aTc, and 25 ng/ml aTc. (B) Histogram (based on the experiment shown in A) displaying the distribution of the average cellular fluorescence intensity for the different aTc concentrations. The OFF bin in this experiment was set between 0 and 10 A.U., based on visual inspection of the raw microscopy images. The first ON bin was between 10 and 50 A.U. and subsequent bins were defined every 50 A.U. The number of cells (n) used for quantification was as follows: n = 2050 (1 ng/ml aTc), n = 1678 (2 ng/ml aTc), n = 1751 (4 ng/ml aTc), n = 1726 (8 ng/ml aTc), n = 1871 (12 ng/ml aTc), and n = 1615 (25 ng/ml aTc). The experiment was repeated on several independent occasions and similar trends were observed. The pixel intensities of the images in A are not directly comparable with each other and the images are merely a qualitative illustration of the differently sized subpopulations observed. The image panels in A represent the phase contrast channel merged with the GFP fluorescent channel. Bar, 5 µm.

