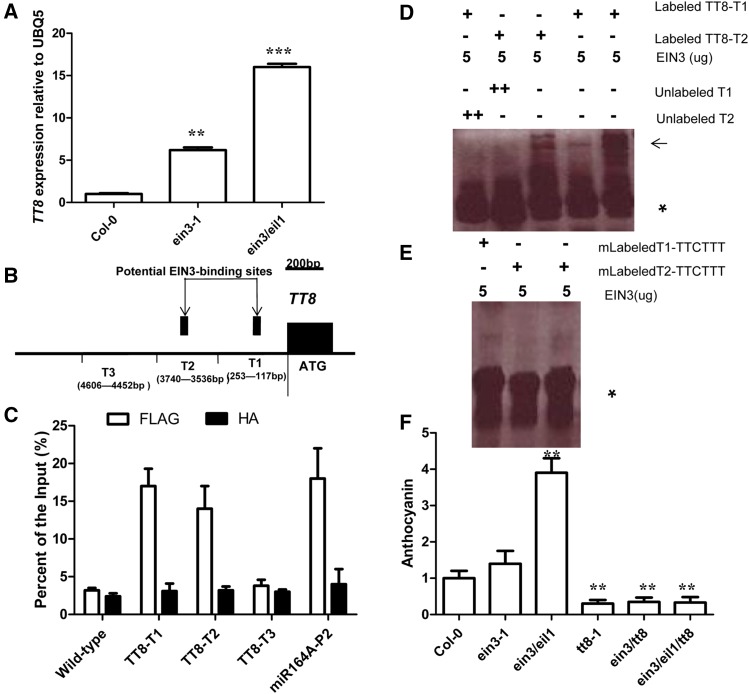
Figure 5.
TT8 is a target gene of EIN3. (A) Bar graph showing expression of TT8 between Col-0, ein3-1, and ein3/eil1 seedlings grown under white light conditions. Seedlings of at least five independently propagated lines were utilized. Wild-type data are set as 1.0. Quantification was normalized to the expression of UBQ5. Error bars represent SD (n = 4; ** P < 0.01, *** P < 0.001). (B) Schematic of the TT8 promoter loci and their amplicons for ChIP analysis. (C) Chromatin immunoprecipitation (ChIP) analysis. Enrichment of particular TT8 chromatin regions with anti-HA antibody (as a control) or anti-FLAG antibody in EIN3-FLAG transgenic plants and wild type as detected by real-time PCR analysis. Quantifications were normalized to the expression of UBQ5. Error bars represent SD (n = 4; ** P < 0.01). Input is set as 100% [supernatant including chromatin (input material) is considered as 100%, immunoprecipitated chromatin/input material × 100% for enrichment product of particular TT8 chromatin regions]. P2 promoter of miR164A is a positive control, and the primers used for the P2 promoter have been described previously (Li et al. 2013). (D) Unlabeled TT8 promoter (2.0 μg) was used as a competitor to determine the specificity of DNA-binding activity for EIN3. Free probe and EIN3 probe complexes are indicated by an asterisk and arrows, respectively. (E) A mutant version of the TT8 promoter (AAA/TTT) was labeled with biotin and used for EMSA with EIN3 polypeptides. Free probe is indicated by an asterisk. (F) Bar graph showing the difference in anthocyanin accumulation between all indicated developmental seedling (12-day-old) grown under white light on solid MS medium with 1% sucrose. Col-0 data set as 1.0. Error bars represent SD (n = 10; ** P < 0.01). Experiments were repeated two times with similar results.

