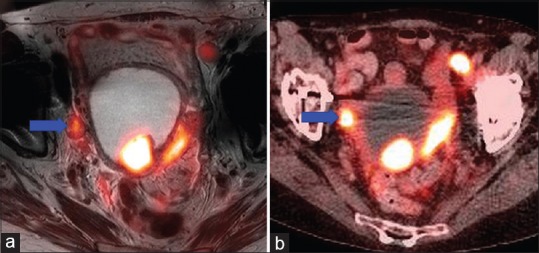
Figure 3.

Positron emission tomography/magnetic resonance (a) showing less intense uptake of nodal metastasis (blue arrow) compared to positron emission tomography/computed tomography (b) likely due to errors in attenuation correction resulting from susceptibility artifacts around a hip arthroplasty
