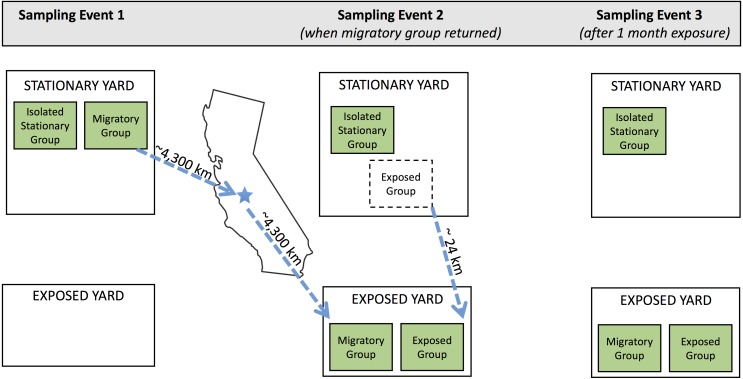
Figure 1. Schematic of experimental design.
Three sampling events occurred during the experiment. Three experimental groups (isolated stationary group, migratory group, and exposed group) were located in two separate apiaries in North Carolina throughout the experiment: the stationary yard (where all groups begin and the isolated stationary group remained for the duration of the experiment) and the exposed yard (where the exposed group was exposed to the migratory group). Dotted arrows show movement of colonies throughout the experiment. Between sampling events one and two, the migratory colonies were transported to California for almond pollination and back. Exposed colonies began in the stationary yard and were transferred to the exposed yard prior to sampling event two. Geographic distance between yards are specified in kilometers.

