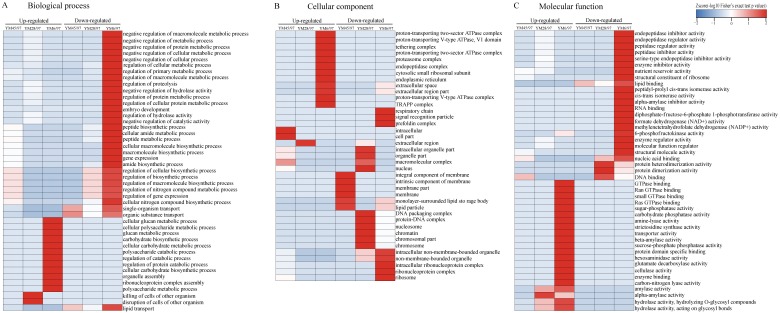
Figure 2. Functional-enrichment-based clustering of DEPs (GO analysis).
(A) Biological process, (B) cellular component and (C) molecular function. Each category of DEPs includes both up- and down-regulated proteins. YM45/97 represents proteins displaying significant changes in Gr45% compared with Gr97%; YM28/97 represents proteins displaying significant changes in Gr28% compared with Gr97%; YM6/97 means proteins displaying significant changes in Gr6% compared with Gr97%.

