Figure 5.
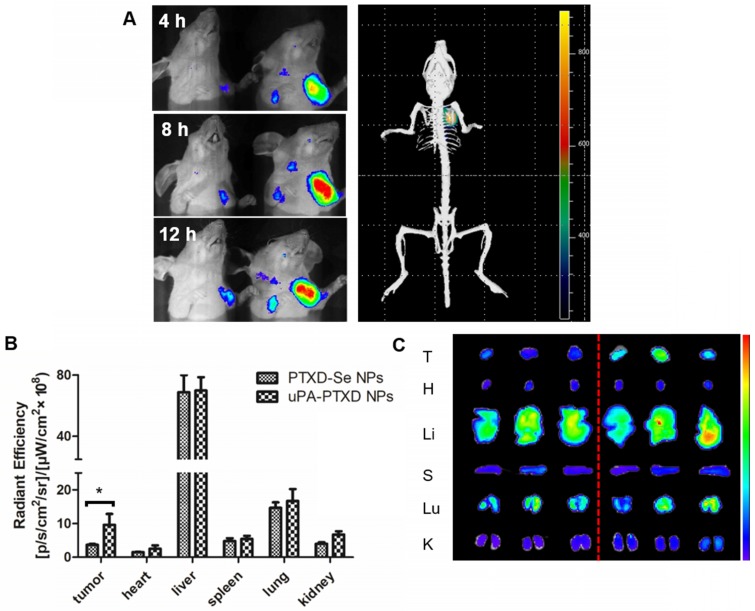
Biodistribution and targeting effects of PTXD-Se NPs and uPA-PTXD NPs in MDA-MB-231 tumor-bearing mice. (A) In vivo 3D imaging 12 h after i.v. injection of uPA-PTXD NPs and in vivo 2D imaging 4 h (a), 8 h (b), 12 h (c) after i.v. injection of PTXD-Se NPs (left) and uPA-PTXD NPs (right). (B) Quantitative fluorescence intensities of tumors and organs from ex vivo imaging. Data are presented as mean ± SD (n=3), *P<0.05. (C) Ex vivo images of tumors and organs of tumor-bearing mice sacrificed at 12 h after i.v. injection of PTXD-Se NPs (left) and uPA-PTXD NPs (right).

