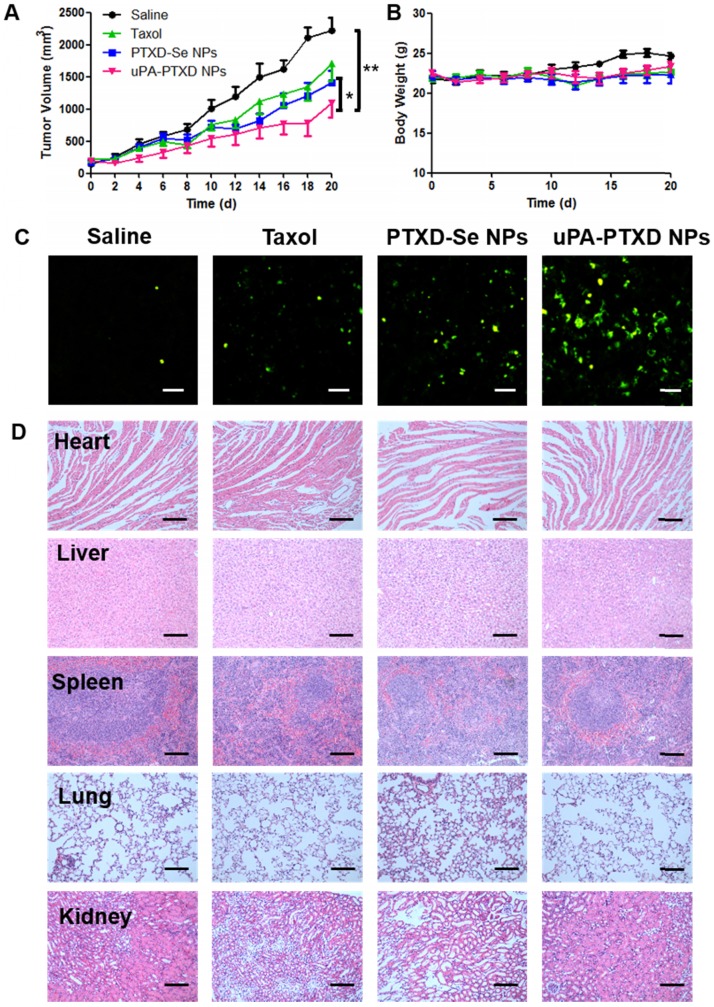
Figure 6.
(A) Tumor volume and (B) body weight changes of MDA-MB-231 orthotopic breast cancer xenograft mice after 4-dose i.v. injection of different PTX formulations at a normalized PTX dose of 5 mg/kg on day 0, 4, 8 and 12. Saline group served as control. Data are presented as mean ± SD (n=8). *P<0.05; **P<0.01. (C) Representative histological images of MDA-MB-231 tumor xenografts of treated groups using TUNEL assay. Green, apoptotic cells; scale bars represent 50 μm. (D) H&E staining of main organs from MDA-MB-231 tumor xenografts of treated groups; scale bars represent 100 μm.

