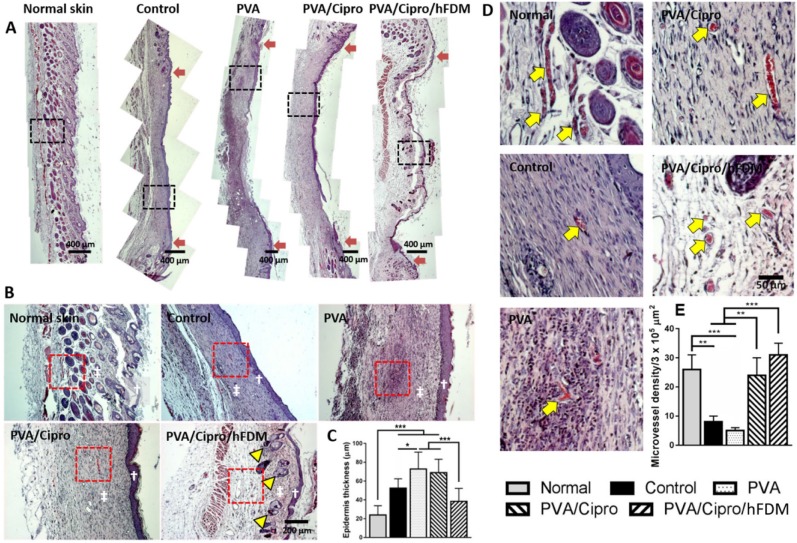
Figure 6.
Skin regeneration in epidermis and dermis on day 21. (A) H&E staining of the excised skin tissues collected at 21 days post-treatments. Red arrows indicate the position of the initial wound areas. Dashed black boxes correspond to the enlarged areas shown in (B). Scale bar is 400 μm. (B) Higher magnification images of regenerated skin tissues, where white dagger (†) and double dagger (‡) denote the epidermis and dermis layers, respectively. Yellow triangles indicate the regenerated hair follicles and glands. Red boxes indicate the area magnified in (D). Scale bar is 200 μm. (C) Thickness of new epidermis. (D) Enlarged images show the presence of microvessels in the regenerated dermis as indicated by yellow arrows and the quantitative analysis of microvessel density. Scale bar is 50 μm. Statistically significant difference: *p < 0.05, **p < 0.01 or ***p < 0.001. H&E: hematoxylin and eosin.

