Figure 2.
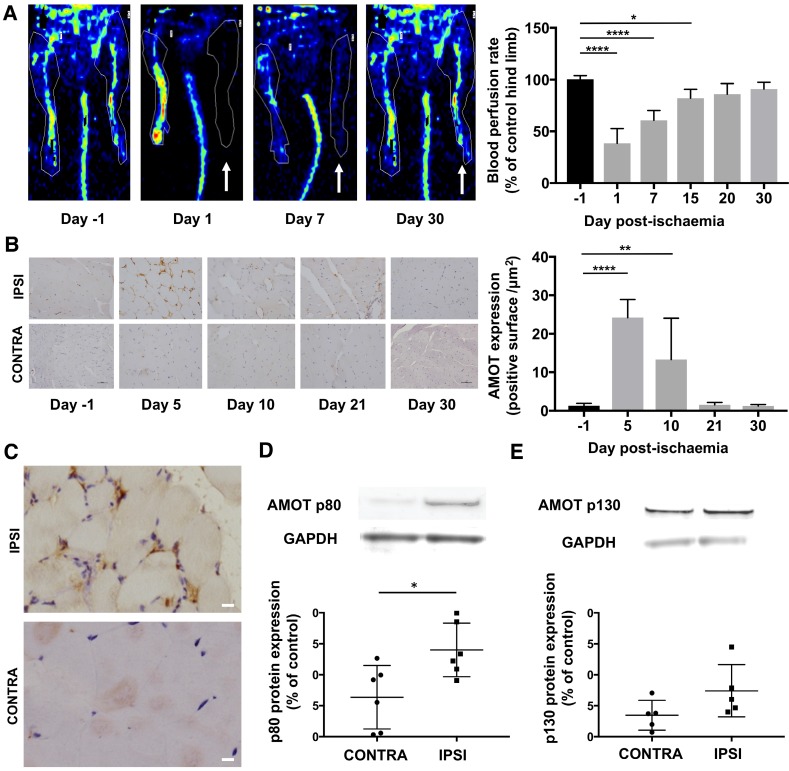
AMOT signal expression was increased after hindlimb ischaemia. (A) LASER-Doppler perfusion imaging showing the gradual recovery of blood perfusion in the ischaemic hindlimb (white arrow: ischaemic hindlimb). Quantitative analysis expressed as ischaemic-to-contralateral muscle ratio (%, mean ± SD) from day 1 to day 30 post-surgery showed a significant decrease in hindlimb perfusion on days 1, 7 and 15 compared to the day before surgery (****P = 0.0001 and *P = 0.014; n = 7). (B) Immunohistochemistry staining of AMOT in hindlimb ischaemic muscle (IPSI) and contralateral muscle (CONTRA). Quantitative analysis showed a significant overexpression of AMOT in ischaemic muscle compared to contralateral muscle. (****P < 0.0001 and **P = 0.004; n = 4). (C) Immunohistochemistry staining of AMOT in hindlimb ischaemic muscle (upper frame) and contralateral muscle (below) at day 5 post-ischaemia. Qualitative analysis showed a co-localisation between AMOT staining and vascular structure in ischaemic muscle. (scale bar: 10 µm). (D-E) Protein expression of AMOT in hindlimb ischaemic muscle and contralateral muscle assessed by Western blot analysis of gastrocnemius muscles at day 5 post-surgery. Results are expressed in relative values on GAPDH expression. Quantitative analysis showed a significant overexpression of AMOT p80 and p130 isoforms in ischaemic muscle compared to contralateral muscle. (*P = 0.034; n = 6 for p80 and P = 0.08; n = 5 for p130).

