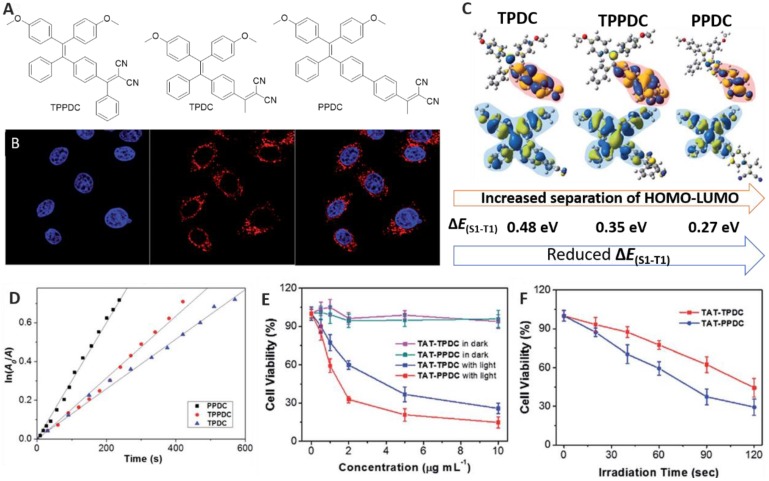
Figure 6.
(A) Structures of AIEgens. (B) Confocal images of HeLa cells upon incubation with TAT-PPDC NPs. (C) Molecular orbital amplitude plots of HOMO and LUMO energy levels of AIEgens. (D) The decomposition rates of ABDA caused by AIEgens. (E) The viability of cancer cells upon treatment with AIEgens NPs with or without light irradiation. (F) The viability of HeLa cells incubated with TAT-TPDC NPs and TAT-PPDC NPs for different durations of light irradiation. Reproduced with permission from 46, copyright 2015 Royal Society of Chemistry.

