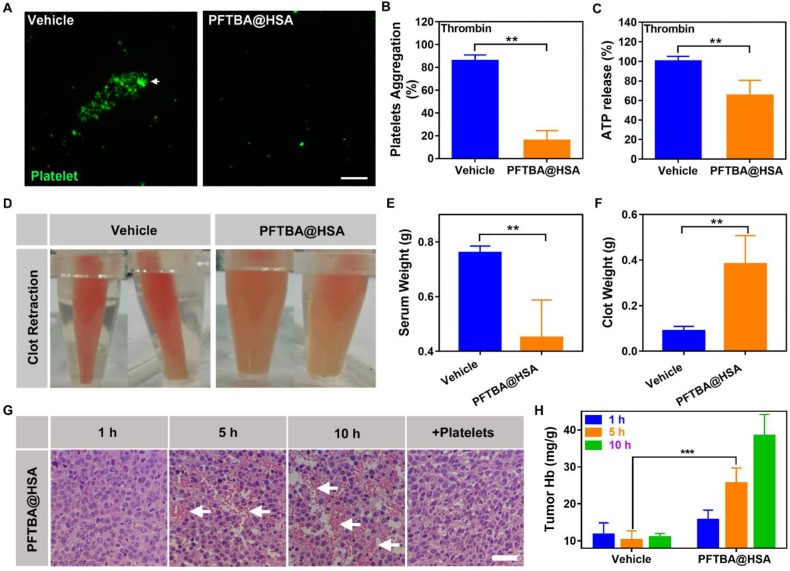
Figure 3.
Effects of PFTBA@HSA on platelet function and RBCs infiltration. (A) Representative image of platelet aggregation activated by thrombin in the presence of vehicle or PFTBA@HSA. White arrows denote the position of platelet aggregation; scale bar = 50 μm. (B) Platelet aggregation induced by thrombin. The data were calculated as the absorbance ratio before and after activation (n=6). (C) ATP release from platelets activated by thrombin (n=6). (D) Representative photos of clot retraction. (E) Quantification of serum weight (n=8). (F) Quantification of clotting weight (n=8). (G) H&E staining of PFTBA@HSA-treated tumor slices at different times. White arrows denote RBCs; scale bar = 25 μm. (H) Quantification of hemoglobin after vehicle or PFTBA@HSA administration (n=6). Data are shown as the mean ± SD. Statistical analysis was performed via one-way ANOVA test. **p<0.01; ***p<0.001.

