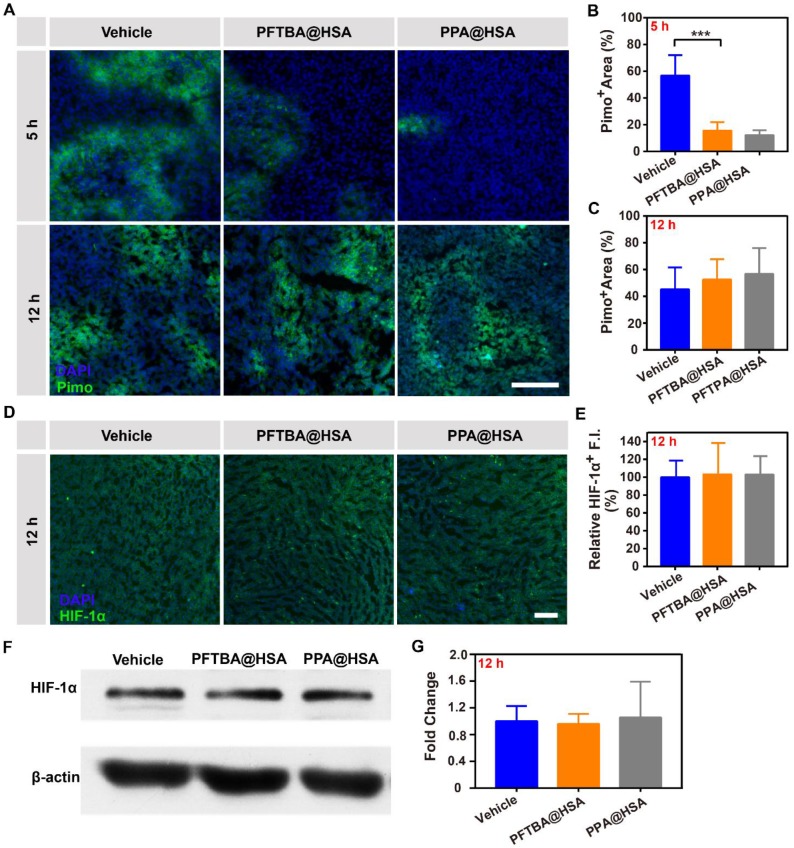
Figure 4.
Effects of PFTBA@HSA on relief of CT26 tumor hypoxia after intratumoral injection. (A) Representative immunofluorescence images of tumor slices stained with the hypoxia probe Pimonidazole at 5 h or 12 h after PFTBA@HSA, PPA@HSA or vehicle treatment; scale bar = 100 μm. (B-C) Quantification of relative Pimo+ fluorescence intensity at 5 h or 12 h after treatments (n=3). (D) Representative immunofluorescence images of tumor slices stained with the hypoxia probe HIF-1α at 12 h after PFTBA@HSA, PPA@HSA or vehicle treatments; scale bar = 100 μm. (E) Quantification of relative HIF-1α fluorescence intensity at 12 h after treatments (n=3). (F) Western blot analysis of HIF-1α expression in tumors from vehicle- and PFC@HSAs-treated mice. (G) Quantification of Western blot analysis for HIF-1α (n=3). Data are shown as the mean ± SD. Statistical analysis was performed via one-way ANOVA test. *p<0.05; ***p<0.001.

